


Qwen3.8-27B mixed-precision EXL3 (measured)
Collection
Four runtime-specific Qwen3.8 EXL3 builds. v5 10M shared-head, body-only KL vs BF16; advisory, not a quality ranking. Context tested separately. • 4 items • Updated • 1
Part of the Qwen3.8-27B mixed-precision EXL3 (measured) collection.
Four EXL3/Trellis quants of Qwen/Qwen3.8-27B, each optimizing a different constraint. The fidelity summaries below describe named BF16-reference KL protocols; KL is not a task-accuracy score.
Model Download Resident v5 10M body-only KLD Context profile (32 GB) TL;DR K5K6-hydrated 21.61 GB 20.31 GiB 0.002760 ~180k Serialized K6 attention; no encode cache K5K6 30.60 GB 20.32 GiB 0.003210 ~180k Attention width is a launch-time knob (K6/K5/K4) K5K6-context 20.70 GB 18.41 GiB 0.003509 262,144 Native 262k context, int8 embeddings, hardware-qualified on RTX 5090 K4 28.31 GB 17.89 GiB 0.010604 262,144 Smallest footprint, native context, no overlay needed All four are VLM (image-text-to-text) and require the Gilded Gnosis vLLM runtime — they do not load in stock vLLM, SGLang, or transformers.
The headline means name the v5 10M suite: 5,120 contexts of 2,048 tokens,
10,480,640 scored positions, 842 source clusters, on the recorded vLLM capture
and shared-BF16-head replay pipeline. They are full-vocabulary
KL(BF16 reference || candidate) in nats, body-only, not native served-logit
or task-quality scores. Candidate head quantization is omitted. In particular,
the context edition's v5 value excludes its int8 input overlay; its native-context
capacity profile is a separate experiment. MTP, vision and long-context behavior
are not measured by these short, text-only teacher-forced means.
Precision and evidence class: these historical v5 values use
float32_reduce_legacy, not full fp64 normalization/reduction. The original
scorer reduced vocabulary chunks in float32 before casting the result to float64;
the receipts' accumulation: float64 label was corrected additively in
QFS correction 6.
The measured values and intervals have not been replaced or re-scored here.
The registry
keeps this group advisory / inspection-only, not a certified ranking: recorded
scopes differ and harness, stack and replay provenance are incomplete. Receipt
model revisions are null; identity relies on their recorded index/config/shard
hashes, not a revision inferred from a repository name.
Lower means, percentages and paired wins below describe these measured pipelines on their named panels, not causal codec superiority, universal model quality, or a guarantee of native-serving order. The reported source-cluster bootstrap intervals require the resampling assumptions; they do not demonstrate coverage for deployment text. Shared arithmetic does not prove that replay/storage effects cancel in candidate differences. The calibration scan establishes no hits under its exact normalized-overlap rule, not absence of every form of contamination.
The v3 full-suite, overlap-corrected v3, v4, v5 shard-0 and v5 10M figures remain separate results. Earlier collection summaries quoted v3 full-suite values; the collection now names v5 10M explicitly without replacing those historical results. The public v5 reports permit aggregate checking, but the historical candidate hidden states and the other shard references were deleted. Re-deriving the full comparison from captures needs new capture work; the shard-0 repeatability checks are not an independently reproduced full-ladder run.
Rebuild interpretation: the one-sibling experiment below is not a bound on converter-population variance or proof of fidelity equivalence. Observed matching control runs establish conditional repeatability, not universal zero error. A rebuild can have different bytes; a download claiming to be this exact artifact must still match its pinned hashes. There is no byte-difference tolerance that rules out corruption or tampering.
Requires a custom runtime. Does not load in upstream vLLM, SGLang, TensorRT-LLM, llama.cpp, transformers, or stock exllamav3. It needs the Gilded Gnosis vLLM fork with explicit
--quantization exl3and an exactignorelist. Treat it as an experimental, runtime-specific research artifact.
Companion to
malaiwah/Qwen3.8-27B-EXL3-K5K6.
Same MLP recipe; one difference: attention is quantized to EXL3 K6 on disk by the
calibrating converter instead of shipping BF16 and being encoded to K6 by the runtime at
every cold start. Measured consequences:
| BF16 attention (sibling) | this build | |
|---|---|---|
| download | 30.60 GB | 21.61 GB (−29 %) |
| resident weights | 20.32 GiB | 20.31 GiB (unchanged) |
| first load, cold | 957 s (encodes 208 projections) | 178 s (5.4x faster) |
| restart with a warm cache | 173 s | 178 s (same) |
| persistent encode cache | required, and must be writable | not used |
| v5 held-out mean KLD from BF16 (body-only, 10,480,640 positions) | 0.003210 | 0.002760 (−14 %, paired −0.000450 on 4,922/5,120 contexts) |
| v3 mean KLD from BF16, body-only (prior receipt) | 0.007945 | 0.007172 (−9.7 %, but see the floor caveat) |
| v3 mean KLD, as served (prior receipt) | 0.008078 | 0.007300 (measured, not estimated) |
| attention width | K6 / K5 / K4, chosen at launch | fixed at K6 |
Choose this build for the smaller download, the lowest recorded v5 body-only mean in this family, and a start that needs no writable cache. Note the nuance: a warm online cache also starts in 173 s, so the 5.4x is about first load and about environments where a persistent cache is awkward — read-only images, ephemeral containers, many nodes. Choose the sibling if you need context: its runtime knob trades fidelity for KV room, and on a 32 GB card that difference matters (see context).
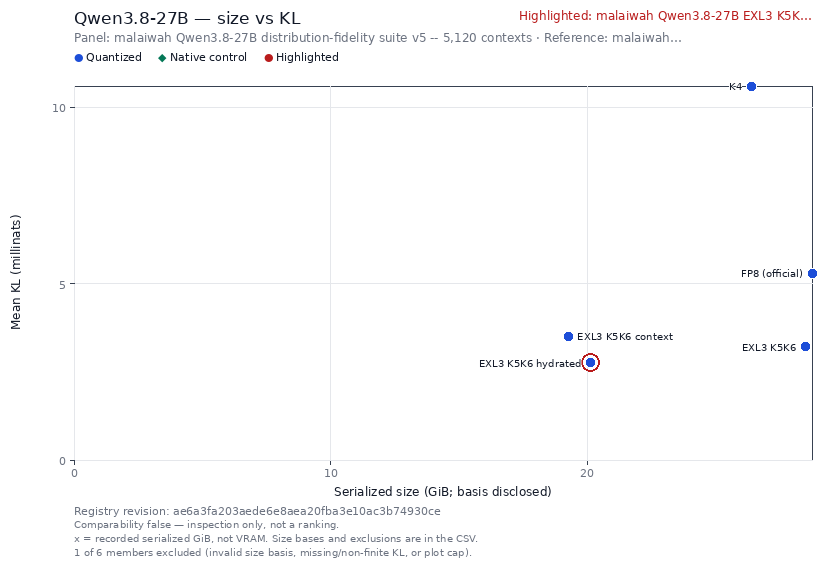
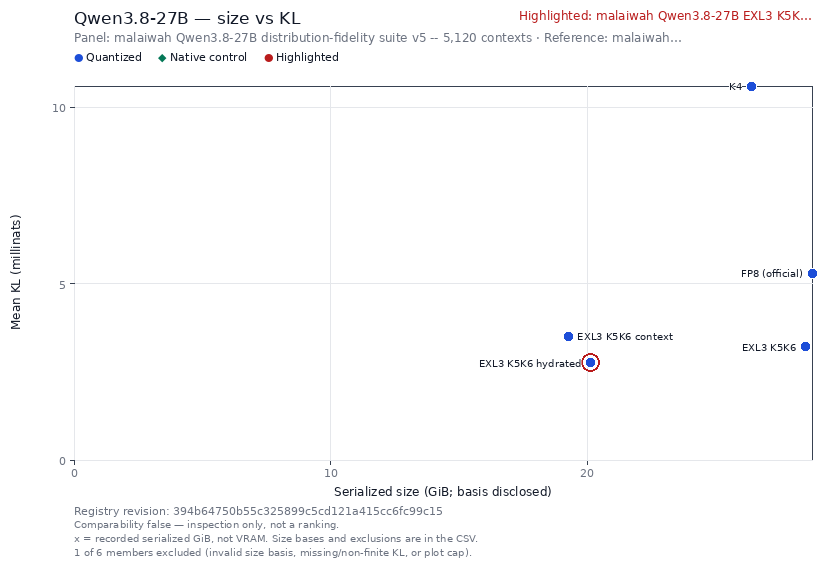
The v5 10M-position shared-head, body-only registry group; this model is highlighted without hiding its peers. The x-axis uses recorded serialized bytes with the basis disclosed, not VRAM or a live download-size estimate. This group is inspection-only, not a certified ranking: the registry retains its scope/provenance limitations and draws no ranking line. Unknown-size peers remain listed in the downloadable data, not assigned invented sizes.
Interactive highlighted plot · PNG · SVG · CSV and exclusions · Full provenance JSON · Live cached image
Registry snapshot: ae6a3fa203aede6e8aea20fba3e10ac3b74930ce. The static image and data above are stored with this card; the live image is explicitly mutable. No model weights or fidelity values were changed by this card update.
Same architecture and tokenizer. The headline KLD column is the v5 held-out suite, 10,480,640 scored positions; the narrower overlap-corrected 127-context v3 subset is kept beside it as the prior receipt. Capacity uses each card's documented profile: hydrated, online and K4 are real RTX 5090 MTP-3 tests; context is MTP-3 with an 8.4 MP cap, qualified on a physical RTX 5090 at utilisation 0.955. These profiles are not interchangeable (collection).

The figure's axis is still the overlap-corrected v3 receipt, because that is what the plotted asset was built from; the v5 ordering of the same five checkpoints is identical (see Fidelity).
| build | download | resident | v5 mean KLD (10,480,640 pos) | corrected v3 mean KLD | context profile | pick it when |
|---|---|---|---|---|---|---|
| -hydrated | 21.61 GB | 20.31 GiB | 0.002760 | 0.007172 | ~180k | lower recorded v5 body-only KL; no encode cache |
| -EXL3-K5K6 | 30.60 GB | 20.32 GiB | 0.003210 | 0.007945 | ~180k | you want the attention width knob at launch |
| -context | 20.70 GB | 18.41 GiB | 0.003509 | 0.009459 | 262,144, MTP-3, 8.4 MP cap | native window, hardware-qualified on a physical RTX 5090 |
| -K4 | 28.31 GB* | 17.89 GiB | 0.010604 | 0.029679 | 262,144 | smallest footprint, native context without any overlay |
Byte and memory conventions for this table. The download column is whole-tree bytes —
every published file of the artifact as its release evidence counted it
(receipts/collection-index.json,
serialized_bytes.whole_tree_bytes: this build 21,610,933,884 B, K5/K6 30,597,231,933 B,
context 20,696,053,306 B) — and they are serialized bytes on disk, never resident memory.
*The K4 release evidence records no tree count, so that one row is the sum of its safetensors
shards, 28,313,841,196 B, read from the published repository. The context edition's resident
weight is measured twice: 18.41 GiB as run on the rental RTX PRO 6000 engine-budget proof
and 18.19 GiB on the physical RTX 5090 at the qualified 0.955 profile. This table prints
the larger figure deliberately, because
receipts/vram-class-verdict.json
elects 18.41 GiB for every class prediction; the 0.22 GiB gap is the rental-versus-5090 delta,
not a change in the checkpoint.
Official Qwen/Qwen3.8-27B-FP8 is 28.51 GiB resident at 0.005294 on the v5 suite
(0.012798 on the v3 subset) and runs on stock vLLM, which none of these do. The two KLD
columns are not comparable to each other — absolute divergence is suite-specific — but they
have the same descriptive mean order under their respective protocols.
| role | representation |
|---|---|
MLP gate_proj, up_proj (64 layers) |
EXL3 K5, mcg |
MLP down_proj (64 layers) |
EXL3 K6, mcg |
attention: linear_attn.{in_proj_qkv,in_proj_z,out_proj} ×48, self_attn.{q,k,v,o}_proj ×16 |
EXL3 K6 on disk, mcg, calibrated (208 modules) |
lm_head |
EXL3 K6, mcg |
| MTP draft head | quantized (fc + attention K4, MLP K5/K6) |
embed_tokens, vision tower (27 blocks), norms |
BF16 |
GatedDeltaNet in_proj_a / in_proj_b (96) |
FP16 passthrough |
Composition, from the emitted manifest: full_attention 1.260 GB (64 EXL3 K6 + 32 BF16),
linear_attention 4.207 GB (144 EXL3 K6 + 96 FP16 + 192 BF16), mlp_gate_proj 3.568 GB,
mlp_up_proj 3.568 GB, mlp_down_proj 4.281 GB, lm_head 0.954 GB, embed_tokens
2.543 GB, vision_tower 0.921 GB, mtp_draft 0.283 GB, norms 0.001 GB. Those roles sum to
21,586,964,548 B = 21.587 GB of tensor payload over three shards; the 21.61 GB download
above is the whole published tree, 21,610,933,884 B, which is 24.0 MB larger because it also
carries the tokenizer, the configs and the chat template.
quantization_manifest.json and build-receipt.json are authoritative for composition;
SHA256SUMS covers the immutable payload. config.json → quantization_config keeps one
bits/codebook pair for loader compatibility and cannot describe this mixed
checkpoint.
Built from Qwen/Qwen3.8-27B
@ 1d4bf0f2ff6012fd82039f2fa52739d0dd7c60c0 with exllamav3
@ 5f3c537ca9d89893d771256f5c43c93656553fbb, plus two allocator hooks upstream does not
provide: EXL3_BITS_FIXED (pins modules before budget allocation — the only way to hold
attention at K6 while the MLP keeps its own split) and EXL3_BITS_OVERRIDE (pins after
allocation). Both are in the
companion repository.
Verified after the build: reconstructing every EXL3 module yields exactly upstream's 1,199 logical tensor names with matching shapes. The finalizer fails closed on any missing, extra or mis-shaped tensor, so this is a check rather than a claim.
The published bytes are the artifact; the recipe is not. This exact recipe was re-converted
on the same hardware with the same flags, the same source and exllamav3 5f3c537, and compared
against the published tree. 13 of the 16 pinned payload files came back identical — every
config, the tokenizer, the safetensors index, quantization_config.json and
quantization_manifest.json — and the three safetensors shards did not. The difference is in
tensor bytes, not metadata: byte-identical headers, the same 2,426 physical tensors with the same
names, dtypes, shapes and data offsets, and the same three-shard packing to the byte.
399 tensors differ and every one is a .trellis payload — 399 of the 409 quantized modules,
97.6 %, with 41-92 % of the bytes differing inside each (mean 82 %). Not one scale, norm,
embedding, vision or BF16 companion tensor moved, and everything a recipe is supposed to fix came
out exactly right: all ten per-role byte totals, 21,586,964,548 B of payload, 1,199 logical
tensors and every module's assigned width. The cause was measured rather than assumed — two runs
of the identical conversion, minutes apart on one box, agreed on every width and every global
scale but disagreed on the converter's own proxy_err for 6 of the 212 modules the comparison
reached, so the converter is genuinely nondeterministic. A rebuild is therefore a sibling of
this checkpoint: same composition, same widths, same byte budget, different trellis payloads. A
different valid artifact of the same recipe, not a broken one
(receipts/converter-determinism.json).
What it changes, and what it does not. Every fidelity number on this card measures the
published bytes — the ones SHA256SUMS pins and a downloader actually receives — so none of them
is affected. And the reading "rebuild this and you get these numbers" is no longer an untested
expectation — it was tested, once, and it held. A third conversion of this recipe on the same
converter worktree came out a sibling in exactly the same way (399 .trellis payloads differing
and nothing else, 39-92 % of the bytes inside each, mean 82.3 %), and was then captured and
replayed on the identical protocol: v5 shard 0, 512 contexts, 1,048,064 scored positions, the
same shared BF16 head, the same comparator. It scored 0.002704 against this checkpoint's
0.002700, and paired per context the difference is −3.755e-06, 95 % source-cluster bootstrap
interval [−2.854e-05, +2.062e-05] over 330 clusters — an interval that brackets zero — on
257 contexts to 255 with no ties, a coin flip with no direction (top-1 97.80 % against
97.78 %). Two controls put the floor of that comparison at exactly zero rather than at a
tolerance: replaying this checkpoint against the same reference capture returned its published
mean and all 512 per-context rows bitwise, and a fresh recapture of it reproduces that mean
exactly, so the −3.755e-06 belongs to the sibling's weights and to nothing in the capture or
replay path. So: 97.6 % of the quantized modules come back with different bytes and the fidelity
is the same to within our resolution, which is what makes "the recipe is the reproducible thing,
the bytes are the artifact" a measured claim rather than a hedge. Read it for what it is — one
sibling, one recipe, one shard, at this protocol's resolution: it bounds the converter's fidelity
variance here, it does not estimate it, and it is not a finding that converter nondeterminism is
fidelity-neutral in general. No published fidelity number acquires a converter-variance term and
none needs amending
(receipts/sibling-rebuild-fidelity.json).
The consequence of the byte difference is still a floor: a byte diff against a published tree is
not evidence of tampering, corruption or a changed recipe until it exceeds this floor, and the
claim worth checking is the digest of the published tree — verify against SHA256SUMS, not
against the output of your own conversion. One environment gap came with the same run: the pinned
image the build record names has no marisa_trie, which this conversion imports twice on
unconditional paths, so that environment provably could not have run the job to completion. The
published environment record is therefore incomplete, and the conversion-capable image is
gg-r34-convert. None of this touches the runtime's weight reconstruction
(reconstruct_fp8_slice, the reconstructed-prefill path below), which turns stored trellis bytes
back into weights at load; that is a different sense of the word and nothing here bears on it. The
1,199-tensor check above is the converter-side sense: names and shapes, verified by the finalizer.
Headline evidence is the v5 held-out suite: 5,120 contexts x 2,047 positions =
10,480,640 full-vocabulary scored positions, about 38x the position count of the
136-context development suite that used to carry this section (kept below as a prior
receipt). KL(BF16 reference ‖ candidate), two passes, no top-k, legacy float32 vocabulary reduction,
both operands replayed through one shared BF16 LM head — body-only, so no candidate's own
head quantization is counted — and a source-cluster bootstrap over 842 clusters.

The widest single view of the evidence: A is the only panel where every family appears
together (v5 shard 0, 512 contexts, 1,048,064 positions, ten candidates — this build is the
leftmost circle at 0.002700), B is the same suite's 1M → 10M ladder (five vLLM builds, 5,120
contexts at 10M), C1/C2 are the superseded corrected v3 (127 contexts, 259,969 positions) and
the source-disjoint v4 (36 contexts, 73,692 positions) on separate y-axes behind a barrier, and
D is turboderp's own published protocol (OpenWebText, 65,536 positions), which we have never
run. Two rules travel with the figure: the cross-engine floor belongs to the llama.cpp rows only,
and no ratio across panels means anything. Generated by
tools/make_master_kld_chart.py,
which reads every one of our values from receipts/ at runtime.
Conditional shard-0 repeatability was reported. 5,240,320 scored positions — five
candidates x 512 contexts x 2,047 positions — reproduce bit-for-bit across independent runs
with separate model loads and different harness generations: every measured field identical,
including the complete per-context arrays and the whole bootstrap block, with only the capture
directory paths and the additively-added tail histogram differing
(receipts/capture-determinism.json),
and a third harness generation's unwindowed --score-from 0 control returns the same shard-0
means to the last digit
(receipts/scored-window-offset.json).
The scope is part of the claim and travels with it: one GPU, one driver, one pinned rootfs,
enforce_eager=True, max_num_seqs=1, one context per forward, 512 MiB bf16 KV. It is not a
claim that vLLM is bitwise deterministic in general — nothing here covers CUDA graphs,
max_num_seqs > 1, chunked prefill with more than one chunk per context, other GPUs or drivers, or
anything downstream of the logits.
| property | value |
|---|---|
| manifest | receipts/kld5-suite-manifest.json, schema qwen38-distribution-fidelity/6 |
| suite token sha256 | 510541f6861b589d44932db253ec25d96d6daaeeee4ea2ab9b65329209482b88 |
| size | 5,120 contexts x 2,047 scored positions = 10,480,640 scored positions |
| source clusters | 842 — the bootstrap resampling unit |
| corpus | 941 documents / 70,348,971 bytes of held-out public text, fetched by tools/fetch_corpus_v5.py (log receipts/kld5-corpus-fetch-log.json, 0 failures) |
| exclusion policy | every document is scanned at every position for exact normalized 12-token overlap with exllamav3 calibration data, and any document with even one hit is dropped before context selection: 44 of 941 documents excluded (43 code, 1 encyclopedic), 897 eligible |
| contamination result | 0 hits by construction: contexts_with_any_hit 0, total_hits 0, 0 decoded candidates rejected against 859,426 calibration shingles |
| disjointness | token-disjoint from the v4 suite: all 160 prior context token hashes seeded, 0 reachable, and 0 contexts emitted from a matching prior source document |
| windowing | exact-advance, adjacent and non-overlapping: 5,120/5,120 candidate windows tokenized with unique token hashes, 0 duplicates, 0 overlapping windows |
| candidate | resident | mean KLD | source-cluster bootstrap 95 % CI | top-1 | exact max single position |
|---|---|---|---|---|---|
| this build (hydrated) | 20.31 GiB | 0.002760 | [0.002540, 0.003020] | 97.70 % | 8.258 |
| online K5/K6 sibling | 20.32 GiB | 0.003210 | [0.002982, 0.003480] | 97.52 % | 22.241 |
| context edition | 18.41 GiB | 0.003509 | [0.003220, 0.003852] | 97.44 % | 5.557 |
Qwen/Qwen3.8-27B-FP8 |
28.51 GiB | 0.005294 | [0.004927, 0.005728] | 96.79 % | 10.714 |
malaiwah/Qwen3.8-27B-K4 |
17.89 GiB | 0.010604 | [0.009640, 0.011746] | 95.76 % | 14.283 |
Replay sensitivity, not an additive floor (interpretation corrected 2026-09-08).
Each mean is body-only shared-BF16-head replay, not the engine's own logit path.
The unquantized-model diagnostic reports KL(live || replayed) = 5.83e-04
on 32 v5 shard-0 contexts / 65,504 scored positions, with context-bootstrap 95 %
CI [5.15e-04, 6.64e-04] and top-1 99.10 %
(receipts/replay-live-floor-v5.json).
It replaced the six-context v3 diagnostic of 6.54e-04
(receipts/v3-qualification-bf16.json);
a separate storage experiment reported a 5.6 % change when hidden storage moved
from BF16 to fp32 (docs/24).
These are protocol-sensitivity observations, not a universal ~6e-4 offset,
~5 % systematic bound, or ~1e-3 resolution threshold. They neither license
subtraction nor prove that errors cancel because the replay code is shared.
The recorded hydrated-minus-online paired contrast is still −4.50e-04
[−4.69e-04, −4.33e-04] on 4,922 of 5,120 contexts
(receipts/kld5-10M-paired.json).
It describes this fixed-panel replay experiment under the reported bootstrap,
not a bound on the corresponding native-logit contrast. The 0.000507
llama.cpp cross-engine control is a different diagnostic and is not subtracted
from these rows. Historical method record:
docs/42-kld-method.md.
This build is 48 % below official FP8 at 71 % of its resident weight, and it is the best of the five on mean KLD, on both interval bounds and on top-1 agreement; the one column where another checkpoint wins is the exact maximum, where the context edition's 5.557 beats this build's 8.258.
Per-candidate receipts:
receipts/kld5-10M-{hyd,k5k6,ctx,fp8,k4}.json,
schema qwen38-kld-ladder-cumulative/2, welded by tools/kld_aggregate.py from ten verified
per-shard reports produced by tools/kld_ladder.sh (per shard: capture six models over 512
contexts, replay five candidates, verify, delete 64 GB of hidden states, next shard). This
build's row is receipts/kld5-10M-hyd.json.
Same contexts, same reference, same shared head; source-cluster bootstrap with 10,000
resamples, seed 1, over 842 clusters. Receipt
receipts/kld5-10M-paired.json:
| comparison | paired mean difference | 95 % CI | contexts won |
|---|---|---|---|
| this build − official FP8 | −0.002534 | [−0.002708, −0.002383] | 5,118 / 5,120 |
| online K5/K6 − FP8 | −0.002084 | [−0.002249, −0.001942] | 5,105 / 5,120 |
| context edition − FP8 | −0.001785 | [−0.001884, −0.001697] | 5,109 / 5,120 |
| K4 − FP8 | +0.005310 | [+0.004710, +0.006019] | 7 / 5,120 (K4 is worse) |
| this build − online K5/K6 sibling | −0.000450 | [−0.000469, −0.000433] | 4,922 / 5,120 |
The offline-versus-online question is settled in direction. The 136-context development run could only show 124/136 contexts favouring calibrated offline encoding, with a 95 % CI of [−0.000977, −0.000572]; at 5,120 contexts it is 4,922/5,120 with [−0.000469, −0.000433] — an interval roughly 11x narrower (3.6e-05 wide against 4.05e-04) around a smaller point estimate. Calibrating attention offline is consistently closer to BF16 than the runtime's calibration-free online encoding, and that no longer rests on 136 contexts.
What is still bounded, honestly: −0.000450 is below this harness's 6.54e-04 live-versus-replay qualification floor, so the v5 run resolves the sign and the consistency of the offline gain, not what it is worth in a live server relative to that floor. The FP8 gap is 3.9x the floor and not in question.
tools/kld_aggregate.py welds the shards at 1M / 2M / 5M / 10M scored positions, and every
one of those checkpoints is recomputable from the per-context rows of
receipts/kld5-10M-hyd.json
(each shard contributes 512 contexts / 1,048,064 positions). This build's mean stops moving
after the first million positions, which is why the run was stopped at ten shards:
| cumulative checkpoint | 1M (1,048,064) | 2M (2,096,128) | 5M (5,240,320) | 10M (10,480,640) |
|---|---|---|---|---|
| hydrated mean KLD | 0.002700 | 0.002759 | 0.002699 | 0.002760 |
The spread across a tenfold increase in positions is 6.1e-05 — more than an order of magnitude below the 0.002534 gap to FP8.
A mean and a top-1 rate say nothing about the worst positions, so here is the whole right
tail. It is measured on shard 0 of the same suite — 512 contexts, 1,048,064 scored
positions — the identical contexts for all five candidates. Receipts
receipts/kld5-1M-tail-{hyd,k5k6,ctx,fp8,k4}.json,
schema qwen38-kld-ladder-cumulative/2, built by tools/kld_aggregate.py; this build's row is
receipts/kld5-1M-tail-hyd.json.
| candidate | mean | p50 | p95 | p99 | p99.9 | p99.99 | exact max | share of positions above 0.1 | above 1.0 |
|---|---|---|---|---|---|---|---|---|---|
| this build (hydrated) | 0.002700 | 0.00109 | 0.0082 | 0.0276 | 0.1319 | 0.463 | 3.735 | 0.1534 % | 0.00219 % |
| online K5/K6 | 0.003141 | 0.00128 | 0.0099 | 0.0321 | 0.1446 | 0.498 | 5.507 | 0.1820 % | 0.00200 % |
| context | 0.003409 | 0.00135 | 0.0107 | 0.0357 | 0.1642 | 0.587 | 3.749 | 0.2287 % | 0.00305 % |
| official FP8 | 0.005197 | 0.00202 | 0.0167 | 0.0531 | 0.2438 | 0.812 | 5.296 | 0.3912 % | 0.00592 % |
| K4 | 0.010345 | 0.00320 | 0.0332 | 0.1194 | 0.5555 | 1.870 | 7.565 | 1.2604 % | 0.03807 % |
Method, in one sentence: every qwen38-fidelity-report/2 replay accumulates a 560-bin
log-spaced histogram of per-position KLD (KLD_HIST_LOG10_LOW=-12.0,
KLD_HIST_LOG10_HIGH=2.0, KLD_HIST_BINS_PER_DECADE=40 in tools/fidelity.py) whose bin
counts add across shards, which is what makes cumulative quantiles possible at all.
What it says for this build. The ordering at p50, p95, p99, p99.9 and p99.99 is the same as the ordering of the means, so the mean is not hiding a worse tail: this build is the lowest of the five at every measured quantile, and on this shard it also has the smallest exact maximum, 3.735. The one column where it is not first is the share of positions above 1.0, where the online sibling's 21 positions edge this build's 23 — 0.00200 % against 0.00219 %, both about a third of FP8's 0.00592 %. Over the full ten-shard run the exact-maximum column goes the other way (8.258 here against the context edition's 5.557); a single worst position is not a tail, which is the point of the table.
Scope, stated exactly:
lower / upper /
estimate per quantile, with a relative bin width of about 5.6 %. The maxima and the
exceedance counts are exact.qwen38-fidelity-report/1, which carries no token-level KLD histogram, so
median/p95/p99/p999 could not be recombined across them. The
tail table above closes that gap on shard 0
(receipts/kld5-1M-tail-*.json); across all 10,480,640 positions only the means, the
intervals, the paired results and the exact global maximum (8.258 for this build) exist.The standing objection to this family's headline is that official FP8 is a throughput format
whose quality is Q4-to-Q5 class, so beating it is a weak claim, and that llama.cpp's Q8_0 and
Q6_K are the honest bar. That is now measured rather than argued.
Three GGUFs from unsloth/Qwen3.8-27B-GGUF@f1bfb127c64f7072bdd2cad55f258b9c8b2910fe were
captured under llama.cpp pinned at commit ece963f41b0b02d7a0d61436ae365762c073a4c8 with
tools/gguf_capture.cpp,
which reads the post-final-norm state — the same mathematical point the vLLM hook takes, with
bf16 rounding verified bit-identical to torch on 2,012,449 probe values — and scored against the
same BF16 teacher through the same shared BF16 head, on shard 0 of the v5 suite: the same
512 contexts and the same 1,048,064 scored positions every row below saw. Manifests come from
tools/gguf_manifest.py
and each one carries the GGUF blob digest and the llama.cpp identity; the build script is
tools/build_llamacpp.sh.
Receipt
receipts/cross-engine-comparator.json,
per-candidate reports
receipts/gguf-report-{q8_0,q6_k,q5_k_xl}.json.

| candidate | engine | measured mean KLD | top-1 | p99.9 | serialized |
|---|---|---|---|---|---|
GGUF Q8_0 |
llama.cpp | 0.001087 | 98.53 % | 0.0351 | 27.05 GiB |
turboderp/Qwen3.8-27B-exl3 6.00bpw @ d32ba0bb |
vLLM | 0.001583 | 98.28 % | 0.0668 | 21.37 GiB file / 17.05 body |
GGUF Q6_K |
llama.cpp | 0.002035 | 97.98 % | 0.0794 | 21.31 GiB |
| this build (hydrated) | vLLM | 0.002700 | 97.80 % | 0.1313 | 20.12 GiB payload |
| online K5/K6 | vLLM | 0.003141 | 97.61 % | 0.1447 | — |
| context edition | vLLM | 0.003409 | 97.55 % | 0.1632 | 19.27 GiB payload |
turboderp/Qwen3.8-27B-exl3 5.00bpw @ a35e75a7 |
vLLM | 0.004005 | 97.37 % | 0.2032 | 18.53 GiB file / 14.22 body |
GGUF UD-Q5_K_XL |
llama.cpp | 0.004444 | 97.20 % | 0.2144 | 18.83 GiB |
| official FP8 | vLLM | 0.005197 | 96.92 % | 0.2440 | 28.51 GiB resident |
| K4 | vLLM | 0.010345 | 95.91 % | 0.5576 | — |
cyankiwi/Qwen3.8-27B-AWQ-INT4 @ 63768c10 |
vLLM | 0.022818 | 93.94 % | 1.13 | 19.57 GiB file |
unsloth/Qwen3.8-27B-NVFP4 @ 9c73e2da |
vLLM | 0.030115 | 93.16 % | 1.6228 | — |
gittensor-model-hub/Qwen3.8-27B-NVFP4-RTX5090 @ 69274a0d |
vLLM | 0.062163 | 89.85 % | 2.5911 | — |
sakamakismile/Qwen3.8-27B-MTP-NVFP4 @ 6d98dc1f |
vLLM | 0.151280 | 84.74 % | 5.65 | 19.15 GiB file |
The engine control, measured and not assumed. The unquantized BF16 GGUF
captured in llama.cpp against the vLLM BF16 reference on identical tokens, the
shared head and the same 512 contexts measures 0.000507 mean, 99.07 %
top-1 and p99.9 0.0113
(receipts/gguf-report-engine-floor.json).
It proves engine confounding. KL is neither additive nor a metric, so the
control is not subtracted and supplies no quantization-only bound.
Four — cells, for two different reasons. Two are the builds that ship BF16 attention for the
runtime to encode at load, so their disk bytes are not a like-for-like payload; the payload figures
are immutable_payload_bytes from
receipts/collection-index.json
(this build 21,610,916,123 B = 20.127 GiB, context edition 20,696,033,532 B = 19.275 GiB; the table
truncates both to two decimals) and are serialized bytes, never
VRAM. The third and fourth are the NVFP4 builds, for which we publish no serialized-byte receipt of
our own — unsloth's 21.34 GiB and gittensor's 18.77 GiB are measured resident weights, which is a
different quantity — so they get no size cell rather than an invented one. The FP8 figure is
resident weights and is labelled as such.
The p99.9 column, and why it differs from the tail table above. These p99.9 values are each report's exact shard-0 p99.9 as the comparator receipt read them; the tail table above quotes the bin-bounded cumulative estimate from the 560-bin histogram, whose bins are about 5.6 % wide — this build reads 0.1319 there and 0.1313 here, and the exact value lies inside the bin the estimate names. The two differ by construction, not by measurement.
The stock uniform-bitrate control, which is the one comparison that can indict our allocation
rather than the format — and at 6-bit it does. turboderp/Qwen3.8-27B-exl3 is EXL3 built at a
uniform bitrate, same format and same engine as this build, so it isolates our role-aware
allocation from EXL3 itself. The two points disagree, and both are published.
At 5 bits the allocation earns its keep: the context edition reads 0.003409 against uniform 5.00bpw's 0.004005 on the same 512 contexts — paired +0.000595 [+0.000533, +0.000665], the control losing 492/512 — and it wins while the control carries 0.664 GiB less transformer body, so the bytes axis favours the control and the allocation still comes out ahead.
At 6 bits uniform bitrate wins. Stock 6.00bpw reads 0.001583 against this build's 0.002700 (paired −0.001117 [−0.001232, −0.001018], 511/512) — but it also carries 1.328 GiB more body, so that comparison is confounded by size. Removing the confound is the point: against the equal-body K6-parity build, at 17.0537 GiB of body bytes on both sides, uniform still edges us 0.001583 vs 0.001634 (paired −5.07e-05 [−6.89e-05, −3.26e-05], CI excludes zero, 341/512). So the 6-bit deficit is not the format, and not fully the bytes: at matched bytes and matched engine our hand allocation gives up a small but statistically real margin to uniform. Whether that margin is allocation shape or calibration content is precisely what the alt-calibration condition was pre-registered to bound — the delta sits above the ±2.9e-05 converter envelope but inside the registered 1e-05..2e-04 content range — and that attribution waits for that measurement rather than being guessed here.
One finding transfers beyond this model: fidelity tracks how gently the SSM path is treated.
Across the three community 4-bit-class builds measured on this shard, the ordering is BF16 >
FP8 > NVFP4 in the state-space/attention path, and it dominates everything else about them.
sakamakismile/Qwen3.8-27B-MTP-NVFP4 puts attention and SSM in NVFP4 W4A4 and pays 0.151280 —
5.02x unsloth's NVFP4, losing 512/512 paired (+0.121164 [+0.113476, +0.130617], with zero
nowhere near the interval) — which measures unsloth's 2.65 GiB FP8 block as decisively
load-bearing rather than incidental. And cyankiwi/Qwen3.8-27B-AWQ-INT4, which loaded cleanly
through CompressedTensorsWNA16/MarlinLinearKernel rather than refusing as the earlier
architecture-gated sweep suggested, reads 0.022818 — it loses 512/512 to the context edition at
near-equal file bytes (6.7x) yet beats unsloth's NVFP4 499/512 (−0.007298 [−0.008410,
−0.006318]) while carrying 2.99 GiB less file. The lesson for anyone allocating bits in a hybrid
model: spend them on the recurrent path first.
NVFP4 on the identical shard, and it carries no cross-engine term.
unsloth/Qwen3.8-27B-NVFP4 at revision 9c73e2da is served by the same vLLM build as our
rows, so unlike the GGUF rows there is no engine term to subtract or estimate and it is directly
comparable to this build. On the same 512 contexts and the same 1,048,064 positions, through the
same shared BF16 head, it measures 0.030115 mean KLD, 95 % CI [0.027637, 0.032965], 93.16 %
top-1, median 0.009584, p95 0.10051, p99 0.33546, p99.9 1.6228, exact worst position 10.6285 and
mean JSD 0.010104 bits
(receipts/kld5-1M-nvfp4.json,
with the run's own account in
receipts/nvfp4-v5-measurement.json).
That is 11.2x this build's 0.002700, 2.9x K4 at the same 4-bit weight class, 5.8x official FP8,
8.8x the context edition and 27.7x Q8_0 as measured; its p99.9 of 1.6228 is 12.4x this build's
0.1313.
Paired per context, which is a stronger statement than any ratio of means: NVFP4 loses every one
of 512 contexts, against both comparators it was paired against. +0.026706 against the context
edition (95 % CI [+0.024465, +0.029285], 0 wins to 512) and +0.024918 against official FP8
([+0.022756, +0.027424], 0 wins to 512) — not one context anywhere in the shard where it is the
better of the pair
(receipts/kld5-1M-paired-nvfp4.json).
It was not paired against this build, so its distance from this row stays a ratio of means and is
not presented as a win count.
gittensor's "RTX5090" NVFP4, measured on the same shard because its card claims the 32 GB /
262,144-token axis by name. gittensor-model-hub/Qwen3.8-27B-NVFP4-RTX5090 at revision
69274a0d (ModelOpt W4A4 body, MTP and vision left BF16, FP8 KV cache baked into its config) is
served by the same vLLM build as our rows, so it carries no cross-engine term. It measures
0.062163 mean KLD, 95 % CI [0.058491, 0.066360], 89.85 % top-1, p99.9 2.5911 — the
weakest row on this table, at 2.1x unsloth's NVFP4 and 23.0x this build. Paired per context it
loses every one of 512 contexts to this build (+0.059463 in this build's favour, 95 % CI
[+0.055973, +0.063458], 512 wins to 0), every one of 512 to official FP8, and 511 of 512 to
unsloth's NVFP4 (+0.032048, [+0.030711, +0.033583]) — the same weight format at 2.57 GiB less
measured resident weight (18.77 vs 21.34 GiB, identical flags, engine-reported), which prices that
memory saving honestly: roughly double the KLD. A bf16-KV control capture moves its mean by only
+0.000365 [+0.000058, +0.000679], so its baked FP8 KV cache explains about 1 % of the gap to
unsloth — the rest is the weight conversion itself. Its card's serving numbers (18.8 GB weights in
VRAM, 275,941-token FP8 KV pool, 80.6 tok/s decode, native 262,144 on one 5090) are its own
claims, which we did not run; our measured 18.77 GiB resident is consistent with the first of
them, and consistency is not verification. Its only published fidelity evidence is a 20-item smoke
that its own card says not to treat as scores
(receipts/kld5-1M-gt5090.json,
receipts/kld5-1M-paired-gt5090.json,
full account with the checkpoint's composition, digests and mirror in
receipts/gittensor-nvfp4-rtx5090.json;
archival mirror
malaiwah/Qwen3.8-27B-NVFP4-RTX5090-archival-69274a0d).
Where this build sits, without format over-attribution. It is the
best-measuring released K5/K6 build under vLLM at 0.002700, below same-engine
official FP8 at 0.005197. Cross-engine, llama.cpp Q6_K measures 0.002035 and
UD-Q5_K_XL 0.004444. These are complete-pipeline observations, not
quantization-format rankings. Their p99.9 values are 0.0794, 0.1313, 0.2144
and 0.2440 respectively.
Correction, 2026-08-16 — the byte axis in the table above is not one axis, and every mixed
comparison flattered us. A GGUF row is the whole file of a text-only artifact; our row is
tensor payload of a multimodal tree that also carries an MTP draft. Read from each artifact's
own tensor table, without downloading any payload
(cross-candidate-byte-accounting.json):
| candidate | file | tensor total | token_embd |
output |
transformer body | multimodal deployed |
|---|---|---|---|---|---|---|
GGUF Q8_0 |
27.05 | 27.04 | 1.258 (Q8_0) | 1.258 (Q8_0) | 24.526 | 27.92 (+ mmproj-BF16 0.867) |
GGUF Q6_K |
21.31 | 21.30 | 0.971 (Q6_K) | 0.971 (Q6_K) | 19.360 | 22.18 (+ mmproj-BF16 0.867) |
GGUF UD-Q5_K_XL |
18.83 | 18.82 | 0.814 (Q5_K) | 0.971 (Q6_K) | 17.034 | 19.70 (+ mmproj-BF16 0.867) |
| online K5/K6 | 28.50 | 28.47 | 2.368 (BF16) | 0.889 (K6) | 24.119 | 28.50, vision inside |
| K4 | 26.37 | 26.37 | 2.368 (BF16) | 0.593 (K4) | 21.463 | 26.37, vision inside |
| hydrated K5/K6 | 20.13 | 20.10 | 2.368 (BF16) | 0.889 (K6) | 15.726 | 20.13, vision inside |
| context edition | 19.27 | 19.25 | 2.368 (BF16) | 0.889 (K6) | 14.886 | 19.27, vision inside |
All figures GiB. The embedding and head widths are not uniform across GGUF tiers, and the vision
encoder is absent from every GGUF text file - it ships separately as mmproj-BF16.gguf, which no
earlier comparison of ours counted. What that does to the four published claims, two against us and
two for us:
Q6_K against hydrated: our sentence understated their byte spend roughly threefold.
"+1.186 GiB more file" is +1.198 on tensors and +3.634 GiB of transformer body (23.1 % more than
ours). Their fidelity win at 6 bits stands exactly as published - it is the price we
mis-stated, in our own favour.Q6_K deployment is 22.18 GiB against our 20.13 GiB whole tree,
so ours is 2.053 GiB smaller and needs no second file.UD-Q5_K_XL against the context edition: this claim was wrong against us. We do not
pay "0.445 GiB more" for the win - on transformer body they carry 2.148 GiB more (+14.4 %),
and our deployed multimodal artifact is 0.422 GiB smaller.Q8_0 against online K5/K6: the bodies agree to 1.7 % (24.526 against 24.119), the
most format-comparable pair on the table, and they win it cleanly. That row is the reason the
others are worth reading: this is not a table where every axis favours the author.Rule from here on, and it is printed rather than footnoted: "at equal file bytes", "at equal tensor bytes", "at equal transformer body" and "as a deployed multimodal artifact" are four different claims, and whichever one a sentence means is written into the sentence. No fidelity number changes.
Update 2026-08-16 — a near-equal-file-byte K6 build. This recipe with
gate_proj and up_proj promoted K5 → K6 measures 0.001634 mean KLD
[0.001541, 0.001742], top-1 98.248 %
(k6-parity-kld.json).
It beats this hydrated build by 0.001066 [0.000974, 0.001173] on 511 of
512 contexts for +1.348 GiB, and its complete vLLM pipeline measures
0.000401 below the llama.cpp Q6_K pipeline on 493 of 512. The cross-engine
control cannot turn that into format parity or prove a byte-gap mechanism. It
carries 2.306 GiB (13.5 %) less transformer body than Q6_K.
Two disciplines this exercise was run under, both worth more than the result: the payload was
predicted at 23,035,310,148 B and measured at 23,035,310,148 B, zero error; and the registered
95 % interval [0.001175, 0.001601] missed — the measurement is 0.0000328 (2.0 %) above its upper
bound, so all three estimators bracketed on the pessimistic side, with the role-share bound worst
and the byte-law-at-Q6_K's-surplus form best, the opposite of what the surrogate's calibration
implied. The published point prediction of ~0.0016 was within 2.1 % of measurement, the most accurate
advance prediction this project has made — and the miss is printed beside it rather than dropped.
Related artifact: the near-file-byte K6 variant of this recipe — gate_proj and up_proj promoted K5 → K6 — is published as malaiwah/Qwen3.8-27B-EXL3-K6-parity and measures 0.001634 [0.001541, 0.001742] under vLLM versus Q6_K at 0.002035 under llama.cpp, for +1.348 GiB over this build; the cross-engine result does not establish format parity.
The complete-pipeline observations worth stating plainly:
Q6_K measures 0.002035 and this
vLLM build 0.002700.UD-Q5_K_XL 0.004444.The engine mismatch prevents format attribution in both directions. Q8_0
has the lowest measured complete-pipeline KL at 0.001087 for 27.05 GiB, and
every GGUF point at or above 5 bits measures lower than official FP8. Those
cross-engine observations make our "34-48 % below FP8" headline a weaker
achievement than it sounds. Same-engine K4 and Unsloth NVFP4 comparisons
remain directly attributable to the tested vLLM pipeline.
What this comparison does not settle. It is text-only teacher-forced fidelity on one shard of
ten. It says nothing about serving 262,144 tokens with vision and MTP on a 32 GB card, which is
where these artifacts actually differ, and llama.cpp KV-quant behaviour, prefill and decode speed
are separate axes that were not measured here. The GGUF rows are also a shard-0 ranking, not a
paired per-context bootstrap against the ten-shard rows in
Fidelity, because those were welded from a different position count. Shard 0 is one tenth of the suite, and it is close to it: over all 10,480,640 positions the five vLLM
means read 0.002760 / 0.003210 / 0.003509 / 0.005294 / 0.010604 — 1.9-2.9 % above these shard-0
values, ordering unchanged (receipts/kld5-10M-{hyd,k5k6,ctx,fp8,k4}.json). The GGUFs have no
ten-shard equivalent; extending them is unrun.
One protocol objection, bounded rather than argued. llama-perplexity scores only the second
half of each window, so every position it scores has at least 256 tokens of left context, while our
suite scores from position 0. Re-scoring our own captures under that restriction lowers every
candidate's mean by 1.3-2.1 % at a 256-token floor and 3.9-4.9 % second-half-only,
uniformly enough to change no ordering — this build reads 0.002660 and 0.002580 respectively
(receipts/scored-window-offset.json).
The external protocol's scoring floor therefore explains at most about 5 % of any cross-protocol
gap, and nothing in the ordering above.
The rows above are those GGUFs on our axis. They have also been measured on theirs, run
exactly as its authors run it, so the two can be cited side by side without either being converted
into the other: llama-perplexity --kl-divergence on WikiText-2 raw test, n_ctx 512,
147,900 scored positions, KL(BF16 GGUF ‖ candidate) with both operands inside llama.cpp and
each candidate's own output head inside the measured path, base Mean PPL 6.950230 ± 0.044933
(receipts/wikitext-kld-run-a.json;
full protocol, delta by delta, in
docs/35-external-protocol-comparability.md).
| quant | their protocol, their corpus | their top-1 | our protocol, measured pipeline |
|---|---|---|---|
Q8_0 |
0.000926 ± 0.000042 | 98.761 % | 0.001087 |
Q6_K |
0.002286 ± 0.000108 | 97.875 % | 0.002035 |
UD-Q5_K_XL |
0.004426 ± 0.000167 | 97.178 % | 0.004444 |
The ordering is identical, but no ratio or conversion is valid across the
protocols. They differ in corpus, scoring window, head and engine; our GGUF
rows are additionally cross-engine. The 0.000507 BF16 control proves
confounding and cannot be subtracted.
Correction, 2026-08-16: This paragraph used to call the output head "the large one". It is now measured on our own corpus and it
is not: replaying each candidate through its own head over all 512 shard-0 contexts and 1,048,064
positions raises its mean by at most 5.28 % (hydrated 5.01 % of head-inclusive divergence,
context 4.06 %, K4 1.17 %, unsloth NVFP4 2.64 %, and exactly 0 % for the official FP8 export, whose
head is byte-identical to the shared one — the internal control), every interval excluding zero
(receipts/head-attribution-v5.json).
Scoring geometry is worth ≤4.9 % by the same kind of control. So the two protocol terms we have
quantified are together far too small to explain a 1.1-1.6x level difference: the level gap is
not decomposed, the leading unmeasured candidates being their 512-token English-encyclopedic
windows against our 2,048-token five-strata ones, and the width of a GGUF's own output.weight,
which is a different tensor from any head measured above.
Their harness's own floor, measured on our hardware instead of assumed. The Minimum KLD
column is negative for all three — −0.000080, −0.000056, −0.000077, i.e. 5.6e-5 to 8.0e-5 — the
uint16 16-nat log-probability encoding showing through rather than a candidate beating its own
reference. The same term appears in the perplexity: 6.9525 in the capture log against 6.950230 in
the scoring runs, identical weights on identical tokens, differing only by that stored round trip.
Tokenization is not part of the difference, and that is a measured null result. llama.cpp's
GGUF BPE and our Hugging Face tokenizer produce bit-identical 297,194-token streams over this
corpus — same int32 digest, no first divergence index — and the 296,960-token prefix that
llama-perplexity actually scores is identical too
(receipts/wikitext-kld-token-identity.json).
And one finding worth its own line: perplexity does not reproduce the KLD ordering. Q6_K has
the smallest PPL delta of the three, +0.00079 against the 6.950230 base, while Q8_0 — the
better quant by every divergence statistic, including a mean 2.5x lower and 0.9 points more top-1
agreement — is +0.00467. A quantization that shifts the distribution can shift it in the
direction that happens to flatter a corpus mean, which is an argument for the metric this whole
section is built on and against ranking quants by perplexity delta.
What this cross-citation cannot do is put this build on their axis: llama-perplexity cannot
read an EXL3 checkpoint. The table at the top of this section, where every candidate is scored by
one harness on one suite, stays the primary comparison.
This is the suite that guided recipe selection, and it was this card's headline until the v5
run above superseded it as the strongest evidence. Numbers unchanged. Held-out corpus, 136
analysis contexts, 278,392 full-vocabulary scored positions, KL(BF16 reference ‖ candidate),
two passes, no top-k, one shared BF16 LM head for both operands, source-cluster bootstrap.
Same suite, reference and head as every comparator in the table:
| candidate | resident | mean KLD | bootstrap 95 % CI | median | top-1 |
|---|---|---|---|---|---|
| this build | 20.31 GiB | 0.007406 | [0.00543, 0.00978] | 0.001335 | 97.19 % |
| BF16-attention sibling | 20.32 GiB | 0.008157 | [0.00607, 0.01067] | 0.001529 | 96.97 % |
Qwen/Qwen3.8-27B-FP8 |
28.51 GiB | 0.013126 | [0.00981, 0.01709] | 0.002343 | 96.22 % |
unsloth/Qwen3.8-27B-NVFP4 |
21.34 GiB | 0.094978 | [0.06858, 0.12688] | 0.012911 | 90.53 % |
NVFP4 now has a v5 row, and the two must never be mixed. It reads 0.092727 on the corrected
v3 subset below and 0.030115 on v5 shard 0 — same checkpoint, same revision, same flags, same
shared-head protocol — and it appears in the
shard-0 table above. That gap is suite hardness, measured for
all six candidates rather than argued: v3-corrected ÷ v5 shard 0 is 2.4625x official FP8,
2.5293x the online sibling, 2.6564x this build, 2.7505x the context edition, 2.8688x
K4 and 3.0791x NVFP4 — a band spanning 1.2504x end to end, with the ordering identical in
both suites
(receipts/nvfp4-v5-measurement.json,
block suite_comparability_v3_vs_v5). A band of factors and not one factor is why no conversion
between the suites exists: the ordering carries across, an absolute value never does, and a v3
number must never appear in the same sentence as a v5 number.
Overlap-corrected subset: a later all-position 12-token scan found exact calibration overlap in 2/41 source documents that the original fixed-stride scan missed. Conservatively removing their nine contexts gives this build 0.007172, the online-K6 sibling 0.007945, official FP8 0.012798, and NVFP4 0.092727 over 127 contexts. No ordering changes. The v5 suite applies that same all-position rule before selection, which is why its contamination count is zero by construction rather than by correction.
Paired on identical contexts:
Body-only versus as-served. Every row above replays both operands through one shared BF16 head, so no candidate's own head quantization is counted — that is what makes the ranking fair, since official FP8 serves a BF16 head. Measured directly on this checkpoint with asymmetric heads (reference through the true BF16 head, candidate through this build's dequantized K6 head): the head costs +0.000125 (95 % CI [+0.000107, +0.000144], 9/136 contexts favour it), so as served this build is 0.007532 with 97.08 % top-1. On the overlap-corrected 127-context subset, the measured result is 0.007300 with 97.05 % top-1; the head increment is +0.000128 (95 % CI [+0.000110, +0.000146], 8/127 contexts favour it). The original as-served result is still 1.74x better than FP8's body-only 0.013126.
Weakest control: live-versus-replayed logit qualification is 5.83e-04 on this harness, re-derived inside the v5 suite (32 contexts, 65,504 positions, [5.15e-04, 6.64e-04]) and superseding the six-context v3 figure of 6.54e-04, so differences below ~1e-3 are not resolvable. The −0.000751 offline-versus-online gap sits at that floor: the bootstrap interval excludes zero and 124/136 contexts agree on direction, but treat the magnitude as a point estimate. The FP8 gap, at 7.6x the floor, is not in question.
Development-set caveat: the recipe was chosen with this 136-context suite visible. The source-disjoint qualification below is the post-selection test, and the v5 suite above is a second, much larger held-out run built after every recipe decision was frozen.
The v3 numbers above come from the suite that guided recipe selection. This is the test that did not: 160 new contexts from 100 documents with zero intersection with the development suite (context token hashes 0/160, document names 0/100, content hashes 0/100), partitioned by whole source cluster, run once, with no recipe changed afterwards. The v5 suite is token-disjoint from this one as well, and supersedes it on size.
The original 42-context table used a fixed-stride character overlap scan. A later, offset-independent scan found exact 12-token calibration overlap in four qualification source documents. Applying the same conservative rule to every candidate — exclude every context from any source document with even one hit — leaves 36 contexts / 24 clusters:
| candidate | mean KLD | 95 % CI | top-1 | paired vs FP8 |
|---|---|---|---|---|
| hydrated | 0.003093 | [0.002577, 0.003684] | 97.63 % | −0.002798, 36/36 |
| K5/K6 online K6 | 0.003455 | [0.002916, 0.004060] | 97.50 % | −0.002436, 36/36 |
| context edition | 0.003990 | [0.003268, 0.004797] | 97.36 % | −0.001901, 36/36 |
Qwen/Qwen3.8-27B-FP8 |
0.005891 | [0.004901, 0.006985] | 96.72 % | — |
The correction changes no ordering or paired win: the three EXL3 builds remain 47 / 41 / 32 % below FP8. The original 42-context figures and the candidate-independent correction are both preserved in docs/31. Absolute magnitudes remain suite-specific.
70 MMLU-Pro questions, 14 official categories, 5 per category, pinned
TIGER-Lab/MMLU-Pro@b189ec765aa7ed75c8acfea42df31fdae71f97be, official five-shot category
prefixes, greedy, thinking at low reasoning effort, 5,120-token completion cap. The BF16
control ran first and the acceptance rule was frozen in
receipts/public-capability-plan.json
before any candidate result was seen. Every candidate answered the same 70 items in the same
order through the same extractor, so each row below is paired item-by-item against that
control.
| model | absolute | Wilson 95 % | BF16-pass retention | Wilson lower | regressions | improvements | completion-cap failures | receipt |
|---|---|---|---|---|---|---|---|---|
Qwen/Qwen3.8-27B BF16 |
57/70 (81.4 %) | [70.8 %, 88.8 %] | reference | — | — | — | 4 | bf16 |
| context edition | 58/70 (82.9 %) | [72.4 %, 89.9 %] | 56/57 | 90.7 % | 1 | 2 | 3 | ctx |
| K4 | 57/70 (81.4 %) | [70.8 %, 88.8 %] | 55/57 | 88.1 % | 2 | 2 | 4 | k4 |
| this build (hydrated) | 56/70 (80.0 %) | [69.2 %, 87.7 %] | 54/57 | 85.6 % | 3 | 2 | 4 | hyd |
Qwen/Qwen3.8-27B-FP8 |
56/70 (80.0 %) | [69.2 %, 87.7 %] | 55/57 | 88.1 % | 2 | 1 | 4 | fp8 |
| online K5/K6 | 55/70 (78.6 %) | [67.6 %, 86.6 %] | 54/57 | 85.6 % | 3 | 1 | 4 | k5k6 |
The frozen plan accepts a candidate when BF16-pass retention has a Wilson 95 % lower bound at or above 0.90 and no category loses more than two BF16 passes. The category clause is met by all five candidates — the worst case is two passes in philosophy, for this build and for online K5/K6 — so the retention lower bound is the only clause that ever fails.
Only the context edition clears the bar, at 90.7 %. K4 and official
Qwen/Qwen3.8-27B-FP8 read 88.1 %. This build reads 85.6 % (54/57) and does not clear it,
as does online K5/K6. That is a measured shortfall, published exactly as measured, with nothing
retuned afterwards: three of BF16's 57 passes flipped to failures here and two BF16 failures
flipped to passes.
What the shortfall is not. Every interval in the table overlaps every other interval, including the BF16 control's and official FP8's, so the matrix does not rank these builds and this card does not claim it does. This build is not shown to be worse than official FP8, K4 or the context edition on knowledge-and-reasoning tasks, and it is not shown to be better than any of them either.
With 57 BF16 passes as the paired denominator, 56/57 is the smallest count whose Wilson 95 % lower bound clears 0.90 (56/57 → 90.7 %; 55/57 → 88.1 %; 54/57 → 85.6 %). A single paired regression is therefore the entire budget, and no result that gives up two can pass, however sound the build. The suite simply has too few items to certify the bar it pre-registered, and at this size it separates nothing: the point applies to official FP8 exactly as it applies to the EXL3 builds. Read it as a power limitation of a 70-item draw, not as evidence that any of these checkpoints is broken.
receipts/public-capability-bf16-superseded-cap2048.json.This is a first public, licence-compatible, item-paired benchmark, not a leaderboard claim. The honest next step is more items, which is the plan's own P1: HumanEval+/MBPP-style executable cases, IFEval-style constraint following, tool schemas, and a larger MMLU-Pro draw. No capability claim on this card graduates before that.
Harness
tools/public_capability.py,
sweep runner
tools/run_public_capability.sh,
suite
receipts/public-capability-suite-mmlupro-70.json.
Every run receipt carries the per-item raw request, raw response, extracted letter, gold letter
and digests.
This is a score for an agent + model system, not for a model. Every number below was produced by Terminus-2 2.0.0 driving this checkpoint on a vLLM OpenAI-compatible endpoint. Terminal-Bench measures whether that system made a container's verifier pass, so a failed task does not by itself implicate the quantisation — it may be the agent's scaffold, the task, a timeout, or the weights. Separating those is what the third pass exists for. The numbers are not comparable to a leaderboard entry unless that entry used the same agent, harness version, sampling and timeouts; ours are pinned so the comparison can be checked rather than assumed.
| Harness | harbor 0.21.0 |
| Benchmark | terminal-bench-2-1@6, all 89 tasks, run from a local tree pinned by sha256 (c13961ac…a48d0ec2) so a registry-side change cannot alter a pass mid-protocol |
| Agent | terminus-2 2.0.0, with an explicit LiteLLM model_info (LiteLLM ships no metadata for hosted_vllm/ names, so without it the agent miscomputes remaining context and its summariser misfires) |
| Sampling | the agent sends no temperature, so each checkpoint's generation_config applies — and those files are byte-identical between this checkpoint and BF16, which is what makes the attribution pass like-for-like |
| Timeouts | task.toml values at multiplier 1.0 (stock) |
| Concurrency | -n chosen from measured serving headroom on the 96 GB card, recorded in the pass receipt |
| Serving | vLLM 0.11.2.dev280+gilded.gnosis.v20…r34, 32,768-token window, fp8 KV, max_num_seqs 16, MTP-3, prefix caching, mamba_cache_mode align, --enforce-eager |
Two deliberate deviations from this card's published 8,192-token recipe, both recorded: the window is
32,768 with fp8 KV, because Terminus-2 summarises when free context runs low and an 8k window
would thrash on Terminal-Bench's long tool-output transcripts — measuring the summariser rather than
the model; and --enforce-eager is kept for the BF16 control arm too, where it is not required, so
that arm differs from this one in the weights alone.
| Pass | Tasks | Weights | Question |
|---|---|---|---|
| 1 | all 89 | this checkpoint | What does the shipped quantisation score? |
| 2 | pass-1 failures only | this checkpoint | Which failures were one-off, which persistent? |
| 3 | twice-failed only | BF16 Qwen/Qwen3.8-27B |
Which persistent failures are the quantisation's fault? |
Pass 3 runs on the same card, same agent, same sampling, same eager mode, same endpoint, and the same
-n 16 concurrency — only the weights change. Each twice-failed task then lands in exactly one of
three buckets, not two:
quantization-suspect — BF16 resolves it, so the quantisation is implicated, with the BF16
transcript published as evidence.capability — BF16 runs to completion and still fails it, so the quantisation is exonerated.inconclusive-timeout — neither arm finished inside the stock budget. This bucket exists
because folding it into capability would exonerate the quantisation on tasks where no arm ever
produced an answer, which the evidence cannot support. Given that timeouts dominate this run (below),
this is not a refinement — it is load-bearing, and the three counts are reported separately and never
summed.The pass-2 filter matters: without it a single flaky failure would be promoted to a quantisation suspect and then spend a BF16 run being disproved.
| Pass | Weights | Tasks | Resolved | Score | Pre-model voids | MTP acceptance | -n |
|---|---|---|---|---|---|---|---|
| 1 | K5K6-hydrated | 89 | 31 | 34.83 % (31/87 = 35.63 % excl. voids) | 2 | 0.5707 | 16 |
| 2 (healing) | K5K6-hydrated | 58 | 13 | 22.41 % — cumulative best-of-2 44/89 = 49.44 % | 3 | — | 16 |
| 3 (attribution) | BF16 control | 45 twice-failed | 7 | — (attribution, not a score) | 2 | — | 16 |
Wall clock for pass 1 was ~3.3 h (18:19Z → ~21:39Z), the tail bounded by the single 12,000-second
task (build-pov-ray), which was the only one outstanding from 88/89. Throughput and acceptance are
deltas between two named /metrics snapshots, both quoted verbatim in the receipt, because the
server's counters carry earlier calibration traffic: over pass 1, +3,330,706 generation tokens and
+3,683,358 draft tokens against +2,102,238 accepted, i.e. 0.5707 acceptance. Server-side prompt
tokens (+26.9 M) exceed the agent's own reported input tokens (12.8 M) because the server counts every
scheduled prefill including speculative and retried work; both are reported rather than reconciled.
BF16 ran the 45 twice-failed tasks under otherwise identical conditions and resolved 7 of them.
Filed into the three buckets
(terminal-bench-2.1-attribution.json):
| bucket | count | what it means |
|---|---|---|
quantization-suspect |
7 | BF16 resolved it; the quantisation did not. Implicated, with the BF16 transcript published. |
capability |
1 | BF16 ran to a verdict without timing out and still failed. The quantisation is exonerated. |
inconclusive-timeout |
35 | Neither arm ever finished. Not evidence either way. |
harness-void |
2 | The qemu pair; no arm could start a terminal. Not attributable. |
| of which provisional | 3 | owed-rerun: their pass-2 attempt was itself a pre-model void. |
So only 8 of 45 persistent failures are attributable at all, and the honest headline is the middle
column, not the first: on 78 % of them this benchmark, at stock timeouts on this hardware, cannot
separate quantisation from capability, because BF16 runs out of clock too. That is the same finding as
caveat 1 arriving from the other direction — and it is why inconclusive-timeout exists as a bucket
rather than being folded into capability, which is where a two-way split would have put all 35 and
thereby "exonerated" the quantisation on tasks no arm ever answered.
One correction worth stating, because it changed the answer. The first run of the classifier
returned capability: 36, inconclusive-timeout: 0, which looked like a clean exoneration. It was a bug
in our tool, not a result: Terminal-Bench runs the verifier even after the agent times out, so a
timed-out trial still carries reward: 0.0, and a rule that tested "is there a reward" counted 35
timeouts as graded verdicts. The corrected rule requires a verdict reached without an
AgentTimeoutError. The 7 suspects were unchanged by the fix; the 35 moved from a bucket that flattered
this build to one that says nothing about it.
The seven implicated tasks are break-filter-js-from-html, configure-git-webserver,
feal-linear-cryptanalysis, headless-terminal, mteb-retrieve, overfull-hbox and
sqlite-db-truncate; the single capability task is query-optimize. A quantization-suspect
verdict is not a claim about which tensor — it says BF16 finished a task this build did not, under the
same agent, sampling, eager mode, endpoint and concurrency.
1. This is a timeout-dominated result. Of the 58 unresolved tasks in pass 1, 54 ended in
AgentTimeoutError and 2 in RuntimeError — leaving only 2 that ran to completion and answered
wrong. 93 % of the failures ran out of clock, not out of ability. The mechanism is measured: turns
spend up to 15,577 completion tokens reasoning, and this system decodes at tens of tokens per second
under concurrency, against minute-scale per-task budgets. Read this score as an agent+model system on
one card at stock timeouts, which is what Terminal-Bench measures — not as a capability ceiling.
2. The concurrency was subsequently measured to be too high, so 31/89 is a floor for this system.
After this pass we ran a synthetic concurrency ladder on the same hardware and found the per-request
knee at C4 for this workload's shape, where per-request throughput still holds ≥50 % of
single-stream. This pass ran -n 16, four times past that knee, at 26 % of single-stream
per-request throughput — which turns the measured 15,577-token burst into ~10.4 minutes of decode per
turn instead of ~3.6. -n 16 was inherited from the harness pins and had never been measured. A
re-run at -n 4 is the obvious next measurement and we have not done it, so this number stands as
published with its serving configuration named, not silently improved.
3. The score depends on the agent's parser tolerating prose before JSON. 52 of 89 trials (58 %)
emit Extra text detected before JSON object; Terminus-2 tolerates it and dispatches the keystrokes
anyway. A stricter parser would have scored this model lower. Within that subset 19 of 52 resolved
(36.5 %) against 31 of 89 overall (34.8 %) — so emitting the warning does not predict failure; an
earlier small-sample reading suggesting it did was noise, and is recorded as such rather than dropped.
4. Two of the 89 tasks never ran on this host, in either arm, and are counted as failures anyway.
qemu-startup and qemu-alpine-ssh die at RuntimeError: Failed to start tmux session before a single
prompt is sent — in pass 1, in pass 2, and in the BF16 control alike. They are environment-unsupported
here, not failed, so the honest denominator is 87; the table reports both, and the headline keeps
the conservative 89 rather than the flattering 87. Because both arms void identically, no task can move
between the quantization-suspect and capability buckets on their account. A third task,
build-pov-ray, lost its pass-2 attempt to a server-side 404 The model 'qwen38' does not exist while
the pass overlapped a model swap — an infrastructure fault that was scored as a task failure because
NotFoundError was missing from the transport-retry allowlist. It has since been added, and the trial
is flagged pre_model_void. That re-run was deliberately not performed, so the cumulative 44/89
stands as a permanent lower bound rather than a pending one: the task carries a 12,000-second
budget — it was the single item bounding pass 1's whole 3.3-hour wall clock — and it had already failed
pass 1 on its own merits, so spending another 3+ hours of a rented card to move a cumulative figure by
at most one task was judged a poor trade. The bound is stated rather than closed, which is the honest
form: 44/89 could be 45/89, and no run will tell you which.
All of this was found by auditing an n_attempted=54 against n_trials=58 mismatch in
the pass-2 publication, and is itemised in
terminal-bench-2.1-pre-model-voids.json.
The stack was validated in two stages before any GPU time was spent, which is the same argument as pre-registration applied to plumbing:
result.json).hosted_vllm/ naming, the explicit model_info, response parsing, the
multi-turn loop, keystrokes reaching a root shell in the container, token accounting, asciinema
and trajectory capture). That run found a real defect — LiteLLM's model_info was missing its
cache-cost fields, which it warned about and which was fixed before the scored passes.Checkpointing was likewise proven, not asserted: resuming a finished job returns in 3.5 s with
every result.json byte-identical, and a job SIGKILLed mid-flight keeps its completed trials
untouched, deletes and re-runs only those in flight, and executes the never-started ones.
Task containers never touch a GPU: all 89 tasks pin gpus = 0, harbor's docker environment
contains no GPU code path at all, and a live task container was inspected showing
devices=[] devreq=[]. Co-tenant containers on that host that do hold /dev/nvidia* are listed by
name in the evidence rather than filtered out of it.
Per-task rows, agent transcripts, verifier output and the receipts are public at
https://huggingface.co/datasets/malaiwah/qwen38-27b-terminal-bench-2.1; the method is
docs/45-terminal-bench.md.
The promoted image ships the un-merged #51812 GDN spec-gate defect (upper bound 0.515/1000 builds
under adversarial traffic). The endpoint also crossed an ssh -R tunnel whose measured round-trip is
581 ms per request — a time-to-first-token cost, not a per-token one, paid identically by both
arms, so it cannot move a task between the attribution buckets. Throughput is therefore read from
vLLM's own /metrics on the serving host's loopback rather than from agent-side wall clock.
This ran before the MMLU-Pro suite above and is kept unchanged. It is the narrower evidence: self-generated tasks with contract checks, not a public benchmark.
On 40 deterministic generated tasks (10 each arithmetic, executable builtins-only code, exact-list instruction following and tool-call schema), BF16 and every comparator scored 40/40. This build had zero regressions and matched BF16's exact final-answer text on 35/40; all five differing answers still passed their contracts. Wilson 95 % lower bound is 91.2 %. This is a transparent smoke suite, not a public leaderboard; full responses are in the run receipt; its extracted-value agreement field is superseded by the strict rescore.
This build carries the same resident weights as the sibling at attention K6 (20.31 vs 20.32 GiB), so its context behaviour is the sibling's K6 arm, which an independent tester measured on a real RTX 5090 (31.39 GiB usable, TP1, FP8 E4M3 KV, MTP-3, decode-only CUDA graphs, vision enabled):
| configuration | KV attained | context | outcome |
|---|---|---|---|
| K6 attention, seqs 8, util 0.95 | 187,050 tok / 6.71 GiB | 185,600 run | stable, multimodal-safe |
| K6 attention, seqs 8, util 0.98 | 202,185 tok / 7.55 GiB | — | text fine, a 3,264-token image OOMed with 33 MiB free |
Native 262,144 does not fit this checkpoint with MTP-3 on a 32 GB card. The engine needs
9.13 GiB of KV. The cost is affine in the window rather than a flat per-token rate:
34,816 B/token × 262,144 + 0.63 GiB, where the per-token term covers 16 full-attention
layers, 4 KV heads, head_dim 256 (the other 48 layers are Gated DeltaNet and hold per-sequence
state) and the 0.63 GiB is a fixed per-request term. Without MTP both fall, to 32,932
B/token and 0.14 GiB, buying ~11 % more length. Both pairs are measured by provoking startup
refusals at two windows (docs/34-vram-class-profiles.md §4.1). Dividing a KV budget by a per-token rate therefore does
not predict a context length, and because the fixed term is per request, raising
--max-num-seqs pays it again for every slot. The 37.4 KB/token this card published
previously was pool ÷ reported tokens at one window, which folded the fixed term in and
overstated the coefficient by about 8 %. The smaller
malaiwah/Qwen3.8-27B-K4 reaches native
length on a real 32 GB card (289,577-token capacity) with no overlay at all.
The context edition is hardware-qualified at native length on a physical RTX 5090: 262,144
with MTP-3 and the full 8.4 MP image ceiling, 265,122 KV tokens of capacity and 1.01x
concurrency at native length, measured at --gpu-memory-utilization 0.955 with
PYTORCH_CUDA_ALLOC_CONF=expandable_segments:True, all seven gates passing
(receipts/qualification-5090-context.json).
On 48 GB and larger, native context fits here at the best fidelity.
That 0.955 is a per-card measurement, not a constant. It is the value that qualified on
one board, GPU-506a575d (32,607 MiB, 458 MiB of it held by the driver); a second physical
RTX 5090 needed 0.956, missing at 0.955 by about 0.01 GiB
(receipts/second-5090-datapoint.json).
Two nominally identical boards differ in exactly two quantities no configuration can move — the
driver's framebuffer reserve and the CUDA context size — and a 68 MiB perturbation in
either was measured to be enough to flip a gate
(receipts/qualification-24gib-capped.json
→ residual_risk_versus_a_physical_board), while one thousandth of utilisation is only about
32 MiB. So if a card refuses to start or OOMs at startup, raise utilisation by 0.001 at a
time rather than dropping the window — and do not lower max_pixels to make room, because at
fixed utilisation that enlarges the KV pool and makes the large-image case fail sooner.
Keep utilisation at 0.95 if you serve images: 0.98 leaves no vision headroom. That 5090
qualification measured the same trap from the other side — at utilisation 0.97 with
PYTORCH_CUDA_ALLOC_CONF=expandable_segments:True (bounded_negative_results arm B2) the
context edition's vision tower died wanting 62.00 MiB with 26.50 MiB free, and at the same
0.97 with no allocator configuration at all (arm B) it died wanting the same 62.00 MiB with
34.56 MiB free; lowering max_pixels
instead of utilisation made it strictly worse, because the engine spends every freed byte on
KV. Utilisation is the knob, on that profile and on this one.
Numbers measured locally at a simulated 31.2 GiB budget (196,608 starts with 246,903 KV tokens; 262,144 refused) agree with the hardware within a few percent, but the hardware numbers above are the ones to trust — the simulation initially omitted MTP's KV and overstated usable VRAM, which produced an overclaim that the tester correctly rejected.
docker run --rm --gpus '"device=0"' --ipc host -p 127.0.0.1:8000:8000 \
  -v /models:/models:ro \
  --entrypoint /opt/venv/bin/vllm \
  voipmonitor/vllm@sha256:820181fbbc975cd5291c411cda9771d58fecee1636d916f508f47230df20592b \
  serve /models/Qwen3.8-27B-EXL3-K5K6-hydrated \
    --served-model-name qwen38 --quantization exl3 --enforce-eager \
    --quantization-config '{"linear":{"weight":"mxfp8"},"ignore":["re:.*visual\\..*","re:.*in_proj_a$","re:.*in_proj_b$","re:.*in_proj_ba$","re:.*mtp\\..*","lm_head"]}' \
    --mm-processor-kwargs '{"truncation":false}' \
    --reasoning-parser qwen3 --enable-auto-tool-choice --tool-call-parser qwen3_coder \
    --max-model-len 8192 --gpu-memory-utilization 0.95 --max-num-seqs 8 \
    --host 0.0.0.0 --port 8000
The container listens on all interfaces internally, but Docker publishes the port to host loopback only. For remote clients, keep that binding and put an authenticated TLS proxy in front; do not expose this unauthenticated generation endpoint directly.
No VLLM_EXL3_ONLINE_TRELLIS_BITS, no VLLM_EXL3_ONLINE_CACHE_DIR: nothing is encoded at
load, which is the point of this build. Three notes carry over from the sibling:
--quantization exl3 is mandatory — auto-detection only fires for GLM-5.2 metadata.ignore list is mandatory and its anchoring is subtle. Prefixes carry no leading
model., so re:.*visual\..* matches while re:.*\.visual\..* silently does not, and the
wrong pattern crashes startup
(#311, fixed by
PR #312). The tested config ignores
mtp.* from the generic BF16 online overlay; EXL3-owned draft projections are selected
before that ignore check and still load from their serialized quantized tensors.--mm-processor-kwargs '{"truncation":false}' is required for images whose expanded
token sequence exceeds 2,048, or requests fail with HTTP 400
(#313).The command above is what the pinned image runs unmodified, so it is eager-only. CUDA-graph decode (+46-50 %) and the measured reconstructed-prefill path (+113 %) need patches still open upstream (#314, #316, and #318); the sibling card carries the exact one-module patch recipe and current sha256. No published image digest contains it.
Prefix caching is on in the recipe below, and it is on here and not everywhere. At an
8,192-token window the KV pool is roughly thirty times the window, so a single request comes
nowhere near the pool ceiling and the failures that stopped the native-context profile cannot
occur. That is not an argument, it is the reason this recipe was measured separately: it starts
healthy on the promoted image with --enable-prefix-caching --mamba-cache-mode align, answers
a text and an image request exactly, and reports enable_prefix_caching: True in the engine
banner
(receipts/production-image.json).
The context edition's native 262,144-token recipe does not enable it, and its card explains
why
(receipts/qualification-5090-apc.json).
The release unit moved on 2026-08-16, and #51113 is why. Upstream vLLM #51113 (mamba
align prefill-chunk splitting: a chunk that ends mid-block leaves its slot holding a short
state, which a later chunk then publishes anyway — wrong tokens, HTTP 200, no crash) merged
2026-08-06, after the pinned public image was built, and is still absent from it and from fork
head fa033bd4e. Cherry-picks were requested upstream on 2026-08-16
(issue #392,
PR #393). Until they land it is carried as
tools/vllm-mamba-align-scheduler.py (sha256 b431c106…), and the image this project serves
is now the four-module localhost/vllm:gg-r34-patched-apc, manifest sha256:16a936b877b90f…,
promoted from the three-module localhost/vllm:gg-r34-patched (sha256:6eca4c693f01b6…)
(receipts/production-image.json).
With prefix caching off the two images are not merely similar but behaviourally identical,
because the added module's changed function is unreachable unless mamba_cache_mode is align
— so the earlier hardware qualification carries over unchanged. One warning if you inspect the
image yourself: its build-time label io.malaiwah.image.qualified still reads false and is
superseded by the receipts named here — it was written before the image could possibly have
been qualified, and correcting it would add a layer and change the very digest that was
measured. That digest is local to the build host, so the recipes here reproduce its content
with sha256-verified read-only mounts over the pullable public base.
What prefix caching buys. On disjoint documents, so the cold case is genuinely cold: a
32,842-token prefix went 12.07 s cold → 1.04 s warm (11.6×, 2,442 of 32,842 prompt tokens
recomputed, 92.6 % hit rate) and a 131,146-token prefix went 67.60 s → 2.31 s (29.3×, 3,146
of 131,146 recomputed, 97.6 %); a 38-request schedule ran 84.0 s with the cache against 144.4 s
without
(receipts/apc-poison-repro.json).
And what we actually know about its safety. Correctness was probed adversarially before any
of this shipped: seven freshly started servers, 38 requests each, 266 scored requests,
nested token prefixes so later requests hit blocks published by earlier ones, and no prompt
length a multiple of the measured 1,600-token mamba block, so prefill chunks end mid-block by
construction — zero corrupted responses, zero wrong answers, zero acceptance collapses, on
the unpatched image as well as the patched one. Thresholds were committed before the first
server started; the worst repeated block was 15 characters against an 80-character threshold,
with no U+FFFD anywhere. Greedy chosen-logprob drift with the cache on is 0.1063 mean absolute
against a measured run-to-run floor of 0.0823 — drift, never an answer change. So the module is
carried as insurance backed by upstream's own regression file — 14 failed / 6 passed
against the vendored scheduler, 20 passed against this one — and not by a reproduction of
our own: we tried hard to reproduce the reported corruption and could not
(receipts/mamba-align-defect.json).
LMCache is unmeasured by us. It is not part of any recipe on this card, this project has never run it, and it is the outstanding suspect in the one user report of prefix-cache corruption we have. Nothing here says LMCache is safe; the evidence above covers vLLM's own prefix cache and nothing else.
#51812 is now recommended if you serve this recipe concurrently with MTP, and it stays an
overlay. Upstream #51812 (Qwen GDN speculative gate ordering: the vendored code gathers the
speculative Q/K/V rows but hands the recurrent update the ungathered a/b gate tensors, so gate
row i can belong to a different token than Q/K/V row i) merged 2026-08-11 and is absent from the
promoted image. Whether that path is ever entered is no longer an argument — it was counted. A
CPU-only instrument over the engine's GDN metadata builder ran the shipped 8,192-token
prefix-caching flags — --enable-prefix-caching --mamba-cache-mode align at a window of 8,192 —
at eight concurrent streams, the sequence count the recipe below also ships, with MTP-3, fp8 KV
and --max-num-batched-tokens 2048 supplied by the arm, and the defective path was entered: three
events in 5,825 metadata builds, 0.515 per thousand, over 468 requests with zero errors and a
prefix-cache hit rate reaching 50.1 %
(receipts/gdn-gate-concurrency.json).
That arm took its window and utilisation from the sibling K4 card, 8,192 at 0.85 rather than this
card's 0.95, and it served the context edition's weights: the counter reads only the scheduler's
host-side arrays, so what it measures is a function of flags and traffic, with the checkpoint
entering only through the size of the KV pool.
The mechanism, in one sentence you can act on: at eight streams with prefix caching on, a short
non-speculative request can land between speculative ones in the same batch, and the unpatched
gather then misaligns the gates. All three firings had one shape — six speculative decodes plus one
non-speculative request, that request beginning at token index 20 and displacing one four-token
speculative decode, whose four gate rows were read from the wrong tokens. The same instrument saw
zero events in 3,329 builds at eight streams with prefix caching off (below 0.90 per
thousand, 95 % upper bound) and zero in 8,065 builds at a quarter of the token budget, so it is the
cache path that opens this, not concurrency alone.
Two conditions gate all of this, and the command below is missing one of them. The changed code
runs only when a batch carries speculative tokens at all — the vendored file takes its speculative
branch only when spec_sequence_masks is not None — so with no --speculative-config, as the
command below ships, the module is a no-op by construction; and at --max-num-seqs 1 no mixed
batch can form either. Add MTP to this recipe, which the concurrency section below discusses as a
depth choice, and the measurement above is what applies at the eight streams it already ships. When
both conditions hold, mount it read-only: tools/vllm-qwen-gdn-spec-gates.py
(sha256 7cd3f5fe763b621048af4817951a841d99c8b700d9a56ded27ccaca5a56ccbe0) over
/opt/venv/lib/python3.12/site-packages/vllm/model_executor/layers/mamba/gdn/qwen_gdn_linear_attn.py.
It is diff-identical to upstream's eight changed lines and py_compile-clean under the image's
Python 3.12.3, and it is an overlay deliberately not part of the qualified digest:
sha256:16a936b877b90f… is what was qualified, and a reachability count is not evidence that would
survive a re-qualification, so it is mounted over the vendored file rather than promoted into the
image.
The effect on answers was not measured, and measuring it was declined on resolution grounds.
Three events in 5,825 builds cannot move a statistic whose run-to-run floor is 0.0823 mean
absolute chosen-logprob error against a per-event effect of 0.002755 — a noise floor about
thirty times the size of one event — so an A/B would have returned its own noise and was
deliberately not run. Nothing here claims the overlay changes an answer, or that it does not. The
recommendation follows a rule fixed before the GPU window opened instead: a nonzero rate in a
regime we ship gets the free fix, because a silently miscomputed forward pass gives the operator no
signal at all. Traffic in that arm was adversarial by design — eight speculative streams plus
injected short prompts and full-cache-hit repeats — so 0.515 per thousand is an upper bound on a
shipped regime, not a forecast for your workload
(receipts/gdn-spec-gate-defect.json
is the source-level defect analysis).
Scope on this build, stated narrowly. What was measured on this profile is that the recipe starts healthy on the promoted image with the cache on, answers a text and an image request exactly, and reports the cache enabled in its banner. That is a serving smoke, not a gate suite: this window has no long-needle, combined-image or decode-dispersion gate of its own, and the 11.6× and 29.3× reuse figures above were measured on the context edition's much longer prompts, not on 8,192-token ones. Expect the shape of the win — recomputing only what changed — rather than those multiples.
Enabling it on this profile is one extra read-only mount and two flags:
set -euo pipefail
git clone https://github.com/malaiwah/qwen38-27b-exl3 && cd qwen38-27b-exl3
cat <<'SHA256' | sha256sum -c -
b431c1066dfee3ed56bfa7e71cc8606f9afadc300f22d7fc542c43835d1b22bf  tools/vllm-mamba-align-scheduler.py
SHA256
SCHED=$PWD/tools/vllm-mamba-align-scheduler.py

docker run --rm --gpus '"device=0"' --ipc host -p 127.0.0.1:8000:8000 \
  -v /models:/models:ro \
  -v "$SCHED:/opt/venv/lib/python3.12/site-packages/vllm/v1/core/sched/scheduler.py:ro" \
  --entrypoint /opt/venv/bin/vllm \
  voipmonitor/vllm@sha256:820181fbbc975cd5291c411cda9771d58fecee1636d916f508f47230df20592b \
  serve /models/Qwen3.8-27B-EXL3-K5K6-hydrated \
    --served-model-name qwen38 --quantization exl3 --enforce-eager \
    --quantization-config '{"linear":{"weight":"mxfp8"},"ignore":["re:.*visual\\..*","re:.*in_proj_a$","re:.*in_proj_b$","re:.*in_proj_ba$","re:.*mtp\\..*","lm_head"]}' \
    --mm-processor-kwargs '{"truncation":false}' \
    --reasoning-parser qwen3 --enable-auto-tool-choice --tool-call-parser qwen3_coder \
    --max-model-len 8192 --gpu-memory-utilization 0.95 --max-num-seqs 8 \
    --enable-prefix-caching --mamba-cache-mode align \
    --host 0.0.0.0 --port 8000
Measured on the user's own physical GeForce RTX 5090 (32,607 MiB, driver 610.57.04) on the
immutable production image localhost/vllm:gg-r34-patched (sha256:6eca4c69…) with no source bind
mounts, and on the context edition rather than this checkpoint — 11 configurations, identical
frozen token-id prompts, three warmed repeats
(receipts/perf-sweep-5090.json,
decision record
docs/36-performance-levers-5090.md).
No figure here may be differenced against any rental RTX PRO 6000 number, per the receipt's own
rule. It is carried on this card because the finding is a serving recommendation for the whole
family, not a property of one checkpoint.
The decision metric is accepted tokens per step ÷ step time, never acceptance rate. The
reference row, MTP depth 3 at --max-num-seqs 8, reads 82.94 / 263.12 / 313.28 tok/s aggregate
at 1 / 4 / 8 concurrent streams with step times 25.72 / 30.64 / 49.52 ms. At one
stream, MTP depth 3 wins: 2.1429 accepted tokens per step over a 25.72 ms step = 83.31
per-request tok/s against depth 1's 1.6558 over 22.29 ms = 74.28. At eight streams it reverses
decisively: num_speculative_tokens=1 costs 22.98 % of accepted tokens per step (2.1753 →
1.6754) but takes 37.25 % off step time (49.52 → 31.07 ms), so aggregate throughput rises
30.67 %, 313.28 → 409.35 tok/s (+22.75 % per request), and it holds 10,911 more KV tokens
(283,481 against 272,570) — the only row whose needle ran at the full 261,794 tokens, retrieved
exactly, with the 30-case image suite unchanged at 24/30. Depth 2 is dominated at both ends, and at
concurrency 4 the choice does not matter (±2.6 %). So: keep depth 3 for interactive single-stream
use, and set depth 1 when the deployment really serves concurrent streams. That 8-stream matrix ran
at --gpu-memory-utilization 0.97 at 262,144 tokens, which is a text-only profile — a large
image OOMs in the vision tower there — so a vision-capable deployment keeps one sequence at the
qualified 0.955.
The crossover exists because each drafted token costs a fixed slice of step time whose acceptance
does not improve with batch size, while a wider batch already fills the step: past some
concurrency the cheaper step buys more than the deeper draft.
What that means for the recipe above, which does not enable speculative decoding: if you add
the sibling card's --speculative-config '{"method":"mtp","num_speculative_tokens":N}', choose
N = 3 for interactive single-stream serving and N = 1 once the deployment really runs eight
concurrent streams. That is the only lever in the sweep worth changing.
Closed avenues, so nobody re-runs them. --attention-backend FLASHINFER is a no-op: the
engine already auto-selects FlashInfer on SM120 with fp8 KV and head_size 256. Forcing
TRITON_ATTN is up to 5.5 % worse on step time at eight streams, and its apparent +5.5 % gain
at temperature 0 becomes −7.3 % at temperature 0.6, so it is acceptance noise rather than
throughput. custom_ops:["all"] is 2.2-5.2 % worse on step time and is not bit-exact. Both
dynamic speculative-decoding knobs are structurally unusable here: either one downgrades
cudagraph_mode from FULL_DECODE_ONLY to PIECEWISE, which Exl3Config refuses, so the server
does not start — and forced eager, the only form that runs, loses 48 % of decode. Dynamic speculative depth is no longer closed — it was a fixable bug, now fixed and
measured (2026-08-16). The cudaErrorIllegalAddress that made VLLM_USE_V2_MODEL_RUNNER=1
unusable was a FlashInfer gate that admitted persistent (CUDA-graph) decode wrappers only for
q_len == 1 + num_speculative_tokens, while the speculator's draft steps run q_len == 1; the
draft-decode graph was therefore captured and replayed on the dynamic wrapper, whose plan
buffers move on every call. Keying wrappers by the shape capture actually planned fixes it
(local-inference-lab/vllm#398, closes
#396; root cause proven with an
instrumented capture-versus-replay address log plus a control that changes nothing except pinning
the capture-time buffers alive). With the fix, one server running the per-batch-size schedule
(depth 3 at batch 1-2, depth 1 at batch 3-8) measures 87.4 tok/s at C1 and 416.3 tok/s at C8,
+38.0 % aggregate decode at C8 against an MRV1 baseline measured in the same window
(301.6 tok/s) with C1 held — depth-1 throughput at eight streams without giving up depth-3 latency
at one. Greedy outputs repeat token-for-token within an engine process in all four arms, and
acceptance does not drop, so the speed is not bought with looser verification. The constraint
that decides whether you want it: at --gpu-memory-utilization 0.97 the V2 runner leaves 58.56 MiB
free and the EXL3 prefill reconstruct OOMs on the first 2,048-token prefill (both arms, schedule off
and on), so the win was measured at 131,072 context and 0.95 utilisation — 234,256 KV tokens
against 272,570 on this card's published profile, −14.1 %. Serving the published 262,144/0.97
profile under the V2 runner on a 32 GB card is not demonstrated. Cross-restart bit-exactness
remains unclaimable on this stack (exl3_gemm autotune is per process). The static depths, 3
single-stream and 1 at eight streams, remain the published recipe until that KV concession is
either accepted or removed
(receipts/v2-runner-depth-schedule.json).
Prefill did not
move on any lever (3,374.4 tok/s at 2,048 and 3,255.4 at 6,144 prompt tokens for the reference
row, no graph-decode arm more than 4.0 % away), so the prefill deficit is structural rather than
untuned.
One reconciliation, because both numbers are published: that 82.94 tok/s at one stream sits below the context edition's qualification median of 107.56 tok/s purely because of acceptance, not speed — 2.14 accepted tokens per step here against 2.69 there, since these frozen prompts are literary prose — while step time agrees to 2.6 % (25.72 ms against 25.05 implied). The two measurements are consistent.
Every arm below served this checkpoint at its native 262,144-token window on RTX PRO 6000 Blackwell
cards (driver 595.58.03), with CUDA-graph decode and prefix caching on, and every arm passed the same
fidelity gate — including a full 262,144-token needle retrieval — before any throughput number from it was
kept. Numbers come from tb21_ladder.py receipts, not from a benchmark harness's own reporting.
One correction to what that gate actually proved. The gate runs five checks, and we later found that
one of them — frozen-prompt repeatability — was vacuous on this model: it hashed the OpenAI content
field, but this model thinks by default and the probe's 64-token cap sent the whole budget to
reasoning_content, so it was comparing empty strings and passing. Liveness, generation, needle
retrieval and MTP sanity were all substantive and are unaffected, so every throughput number here still
stands behind a real 262k needle pass — but we do not claim to have verified determinism, and the
repaired check (now hashing reasoning too, with a guard that fails if nothing was emitted) finds 7-of-8
reproducibility under concurrent load, most likely ordinary continuous-batching nondeterminism.
Method and receipts:
gate-check3-vacuous.json.

| topology | GPUs | single-stream tok/s | peak aggregate tok/s | knee | KV tokens |
|---|---|---|---|---|---|
| 1x | 1 | 134.8 | 558 @C16 | C4 | 1,760,318 |
| TP2 | 2 | 159.6 | 605 @C16 | C4 | — |
| DP2 | 2 | 135.8 | 1,072 @C32 | C8 | — |
| TP4 | 4 | 151.0 | 1,359 @C64 | C4 | 8,769,375 |
| TP2xDP2 | 4 | 156.7 | 1,808 @C64 | C8 | — |
| DP4 | 4 | 134.1 | 1,958 @C64 | C16 | — |
| TP4xDP2 | 8 | 146.5 | 2,206 @C128 | C8 | — |
| TP2xDP4 | 8 | 153.2 | 2,438 @C128 | C16 | — |
| DP8 | 8 | 135.2 | 3,553 @C128 | C32 | — |
| 8 | refused by the current 128-aligned loader/checkpoint layout | — | — | — |
Three rules fall out of this, and they are not the obvious ones.
knee≈4×DP as an
empirical planning rule for this profile, not an invariant across prompt
mixes, schedulers or finer concurrency sweeps.The three eight-GPU arms on one host, each knee marked against the 4 × DP law:

One host-level prerequisite is worth more than any flag here. On direct-attach RTX PRO 6000 systems
P2P can be silently off — we measured can_device_access_peer false, a 64 MiB cross-GPU copy at
35.5 GB/s and a 256 B copy at 12.48 us. Writing the NVIDIA ForceP2P registry override and reloading the
driver enabled it (51.9 GB/s, +46.5 %) and was worth +7 % to +22 % on real tensor-parallel decode —
enough that our first TP2 verdict was wrong before it. Verify P2P before trusting any TP number, ours
included (jarvis-p2p-override.json).

And a correction we owe readers of our own earlier claims. This project previously described decode as
running at "55-65 % of roofline". Both terms of that fraction were wrong, in the same direction. The
numerator undercounted traffic — per-step weight traffic is 20.5 GB, not ~17.4, because the 953 MB
lm_head streams once per draft sampling — and the denominator used a vendor spec no kernel reaches:
a pure-stream kernel measures 1,462-1,525 GB/s on this SKU against the 1,792 GB/s spec. Corrected,
decode runs at 69-85 % of achievable depending on operating point, and the big trellis GEMMs
themselves measure 88-100 % of that ceiling — the kernels are essentially done. A real 15-31 point
inefficiency remains (launch floors, non-GEMM work, CPU gaps), about half of which we have since measured
back. Method, per-kernel numbers and the arithmetic:
docs/47-kernel-gap-analysis.md.
Qwen document this checkpoint as 262,144 native, extensible to 1,000,000 via static YaRN, and warn that static YaRN "potentially impact[s] performance on shorter texts". We measured that cost, twice, on different hardware, with an identical 48-prompt / 384-position probe set and a four-arm decomposition.
| arm | mean top-20 KLD | reading |
|---|---|---|
| same-server replicate, concurrency 1 | 0.0e+00 | bit-identical in this run |
| cross-boot replicate, same launch line | 1.180e-03 | empirical boot-associated background for this instrument |
1M native-rope arm (separate boot, max-model-len 1M) |
1.248e-03 | same observed scale as the reboot control; does not prove a zero window or KV-pool effect |
| static YaRN arm, matched 1M window but separate boot | 1.071e-02 | rope-associated difference is ~9× the boot background |
| native-262k vs 1M-YaRN, one GPU | 1.057e-02 | ~9× boot background; 19 of 48 prompts change their greedy output |
| native-262k vs 1M-YaRN, DP8, 8 GPUs | 1.0265e-02 | replicates within 3 %, inside the 1-GPU marginal 95 % interval |
Recommendation: serve 262,144 native by default. Static YaRN shifts distributions by roughly 1.0e-02 mean KLD throughout this measured 512–32k probe range, about nine times the observed boot-associated background. If more than 262k is required, qualify and route a separately addressed long-context endpoint rather than changing the default path. The 994,755-token needle probe demonstrates retrieval capability near the configured limit; it does not establish general long-context quality.
Two side results worth carrying:
n^k with k rising:
1.506 → 1.744 → 2.144 across 262k → 1M. That shape is consistent with the model's mix of 16
full-attention and 48 linear-attention layers, but the experiment did not isolate a causal mechanism.
A 1M prompt costs 2.53× more per token to prefill than a 262k one in this measurement.Method, controls and an override-took-effect proof (99.97 % of rope-cache entries differ, max abs diff
0.140625 = mscale − 1 in bf16):
yarn-short-context-penalty.json,
yarn-penalty-dp8-transfer.json,
1m-context-effects.json.
The numbers above are ladder measurements. This one is production traffic — text, images and video driven through an agent harness at a DP8 endpoint serving a 1,000,000-token window, with a Terminal-Bench arm running underneath at 16 concurrent. Mixed traffic, which is the realistic case.
| measured | |
|---|---|
| mean GPU utilisation, 8 cards | 92.9 % (median 97-100 % on every card) |
| cross-GPU spread | 14.7 points |
| idle samples | 5.6 % |
| power / SM clock | 382-575 W against a 600 W limit / 2,347-2,407 MHz |
| uncorrected ECC | 0 |
| requests waiting, all 8 engines | 0 — no queueing, no capacity stalls while saturated |
| prefill | 26,183 tok/s aggregate (3,273/GPU) |
| decode | 878 tok/s aggregate (110/GPU) |
| input : output | 29.8 : 1 |
| MTP acceptance | 61.7 % (58.9 % on text-only in the same period) |
Two things here matter more than the utilisation figure.
Multimodal is a prefill workload, and that changes how you price it. Prefill ran 2.72× the text-agent rate while decode rose only 1.41×, because images and video expand into very large token counts. At 29.8:1 input:output — three times the 9.94:1 measured on our text-only Terminal-Bench campaign — the cost of vision traffic is almost entirely input-side, so any price sheet that leads with output tokens will misprice it badly.
The prefix cache measurably pays for agent fleets. The block-level prefix-cache hit rate rose from
26.9 % to 48.0 %, +21 points, when subagent traffic arrived — because subagents share system prompts and
tool schemas, so their prefixes collide. This is the first measured evidence for a benefit this family's
docs had previously only asserted. Unit caveat, because it is easy to over-claim: vLLM's
prefix_cache_queries counts block lookups, not tokens, so 48.0 % is a block-level rate and is not
the fraction of prompt tokens skipped.
MTP acceptance held at 61.7 % under vision load, so the shipped depth schedule [[1,4,3],[5,64,1]] needs
no change for multimodal serving. Full method, telemetry at 5 s cadence and the limits:
multimodal-load-8x.json.
The recipe on this card leaves --kv-cache-dtype unset; the family's qualified long-context
profiles pin fp8, and that default is now measured rather than assumed. A five-arm sweep on
the physical RTX 5090 served the context edition — same engine, same flag surface — at its
native-window profile with the KV dtype the only deliberate flag change: no arm beat fp8 on
native-or-beyond context on 32 GB with retrieval intact
(receipts/kv-dtype-sweep-5090.json,
decision record
docs/38-kv-dtype-sweep.md).
The engine derives the attention backend from the KV dtype, so each arm is measured as it actually
serves:
--kv-cache-dtype |
backend (engine-chosen) | KV tokens at 262,144 | prefill, same 261,795-token prompt | top-1 / trunc. KL vs bf16-KV |
|---|---|---|---|---|
| fp8 (family default) | FLASHINFER | 265,122 | 180.4 s | 95.60 % / 0.001655 |
| int8_per_token_head | TRITON_ATTN | 272,453 | 544.3 s | 97.25 % / 0.000914 |
| fp8_per_token_head | TRITON_ATTN | 272,453 | 545.9 s | 98.84 % / 0.001284 |
| int4_per_token_head | TRITON_ATTN | 502,667 | 501.0 s | 94.29 % / 0.005948 |
| bfloat16 | FLASH_ATTN | 138,519, window capped at 131,072 | — | reference |
The per-token-head family is measured, not assumed: int8 and fp8 per-token-head each dominate fp8
on both capacity and closeness to the bfloat16-KV reference, but each pays 3.0× prefill
because TRITON_ATTN is the only backend on this fork that accepts per-token-head scales — and the
capacity edge is TRITON_ATTN's smaller CUDA-graph pool (0.06 against 0.45 GiB), not cheaper bytes:
those arms cost more per token than fp8 (35,360 against 34,816 B/token). int4_per_token_head
is the real capacity lever — 502,667 tokens, 1.92× concurrency — at two named prices: 3.6× fp8's
distributional error and 2.78× its prefill. nvfp4 and nvfp4_ds_mla do not start: no
attention backend on this fork advertises nvfp4 for a non-MLA decoder — all five candidates answer
kv_cache_dtype not supported — and the GLM-5.2-serves-nvfp4 precedent is the owner's claim about
a different model, unverified here. The fidelity column is a bfloat16-KV-reference probe at a
98,304-token context — truncated top-20 KL over 70–173 paired greedy positions, a lower bound;
it is not the v5 KLD and must never be differenced against any published KLD figure. Retrieval
was 44/44 exact across the five arms, 4-bit included — retrieval is not fidelity, which is
exactly why the KL column exists.
A 2-hunk fork patch to exl3.py buys 17,874 more KV tokens, measured, and it is an opt-in
overlay rather than part of any qualified digest. The pinned r34 image keeps one persistent fp16
prefill-reconstruct scratch per weight geometry — 790 MiB across the eight geometries that
allocate at the qualified long-context profile (the head's 5120×32768 chunk needs ≥128 sampled
logit rows and never triggered). The patch (overlay tools/vllm-exl3-scratch-arena.py, sha256
9aba06ebf60ca7665c0513752387c349240ab85e1ebc44d6ce8137ef157b6c15; fork PR
local-inference-lab/vllm#397) shares one
grow-to-max arena per device instead, sized by the largest live geometry (170 MiB), because
each reconstruct is written and consumed inside one eager call on one stream. The kernels see
identical operands — same shapes, strides and dtypes.
Measured on the physical RTX 5090 A/B: engine-reported KV pool 265,122 → 282,996 tokens
(+17,874, +6.7 %, 9.28 → 9.88 GiB ≈ +0.60 GiB), reproduced identically across two server starts
per arm, the arena's own growth log ending at exactly the predicted 170 MiB
(receipts/scratch-arena.json).
That A/B served the context edition at its qualified 262,144-token profile — same engine, same
flag surface — and the scratch geometries are shape-derived, so the mechanism and the 170 MiB arena
size are identical on this build while the pool figures above are the context edition's. Fidelity
was gated rather than assumed: the 30-case deterministic vision suite returned byte-identical
answers on both arms (24/30 each, equal to the rank-1 qualification reference), a full-window
needle (258,925 tokens, depth 0.5) retrieved exactly, and decode did not regress (109.2–109.7
against 108.5–108.9 tok/s over three warmed C1 runs). Read the byte-identity claim narrowly —
it covers that deterministic probe set, because the control shows two restarts of the unpatched
baseline differ on 7 of 8 long greedy continuations (exl3_gemm autotunes kernel configs by
measured time per process), so this stack is not restart-deterministic on long greedy text with or
without the patch, and every cross-restart pairing is 7 DIFF / 1 MATCH either way.
Like #51812, it is an overlay deliberately not part of the qualified digest: the pinned digest
is what was qualified, a larger KV pool is not evidence that would survive a re-qualification, so
it is mounted read-only over the vendored file rather than promoted into the image —
-v tools/vllm-exl3-scratch-arena.py:/opt/venv/lib/python3.12/site-packages/vllm/model_executor/layers/quantization/exl3.py:ro.
The static prediction had been +620 MiB / +18.7k tokens; the measured gain is 95.7 % of it, and
the measured number is the one to quote. On the 24 GB class the same bytes put the published
24,576-token window at 42,450 raw token headroom, supporting 40,960 at the next window step —
arithmetic only, pending a 24 GB-class boot
(docs/34-vram-class-profiles.md
§10.2).
VLLM_EXL3_EMBED_BITS=8 converts the 248,320 x 5,120 input table to per-row int8 after load
(2.543 GB -> 1.272 GB,
docs/32).
At this family's published 8,192-token profile it moves about 1.2 GiB of weights into KV, measured
on the physical card: hydrated 66.45 -> 67.62 GiB of KV = 668,852 -> 680,899 tokens (+1.80 %,
concurrency 81.65x -> 83.12x); online K5/K6 345,324 -> 352,571 tokens (+2.10 %, 42.15x ->
43.04x). Correctness is unaffected on the frozen probe schedule - 22/22 planted answers and zero
corruption detectors on both arms - but output is not identical: with greedy decoding 13/22
(hydrated) and 10/22 (online K5/K6) continuations diverge from the BF16-table arm tens of tokens in,
which is the served consequence of the +0.000065 mean KLD already published in docs/32.
Recommended only where KV is the binding constraint - long windows, smaller cards, the context
edition it was built for. At 8,192 tokens, where the KV pool is already 42x-82x the window, the
headroom it buys is not worth changing the text a prompt returns
(receipts/embed-overlay-8k.json).
This repo ships chat_template.jinja byte-identical to Qwen/Qwen3.8-27B (sha256
c3cf9e34abf4f9e36c2d72165aa9c132d3e2a725b6c2586aaa3a8af9d7a81041), and the same bytes again in
the chat_template key of tokenizer_config.json. Do not replace one without the other: under
transformers 5.15.0 the .jinja file takes priority, so editing only tokenizer_config.json is
a no-op. To override, pass --chat-template <file>.
Three upstream-template restrictions to code against. All three are Qwen's, unchanged by us, and all three surface as HTTP 400:
reasoning_effort accepts only xhigh (default), medium and low - measured against a
live endpoint, correcting an earlier revision of this card that also listed none. The server
answers HTTP 400 Unexpected reasoning effort none. Supported types are xhigh (default), medium, and low. for none, exactly as it does for high, minimal and max - all of which
vLLM's OpenAI surface advertises and this template rejects. If your client hard-codes high,
serve with --default-chat-template-kwargs.reasoning_effort=xhigh.
What the ladder costs, measured rather than described. Same prompt, temperature 0, 32,768-token
budget so no arm is truncated, two repeats each, on the qualified 1x endpoint
(receipts/reasoning-effort-1x.json):
reasoning_effort |
completion tokens | reasoning chars | latency | finish | correct algorithm |
|---|---|---|---|---|---|
| (unset) | 18,085 | 56,955 | 168.9 s | stop | 2/2 |
xhigh (default) |
18,085 | 56,955 | 168.8 s | stop | 2/2 |
medium |
3,436 | 4,767 | 26.2 s | stop | 2/2 |
low |
3,517 | 4,606 | 27.0 s | stop | 2/2 |
Three things follow. Unset is byte-identical to xhigh, which is how the default is now
measured rather than assumed. xhigh costs 5.3x the output tokens and 6.4x the wall clock of
medium for the same correct answer on this task - the single largest cost knob on the client
side of this card, and the one to reach for first in any agent loop bounded by a per-task timeout
rather than by quality. And low is not cheaper than medium (3,517 against 3,436 tokens):
the bottom of the ladder is flat, so medium is the useful floor. Read narrowly: one prompt, one
shape, an exact-match check on whether the right algorithm is named - it establishes token cost,
not a quality ordering.
Exactly one system message, first. Two system messages 400 with System message must be at the beginning. (vllm#41114, open; fix PR vllm#44505 closed unmerged). Merge them
client-side. A developer role is safe - vLLM folds and consolidates it (vllm#43590).
Content blocks must be text, image, image_url or video. Anything else, including
an Anthropic tool_result carrying a tool_reference item on /v1/messages, 400s with
Unexpected item type in content. (vllm#52489, open).
Only the leading system message is accepted. A second or mid-conversation
system role raises. Clients must merge system instructions into the first
system message before rendering history.
Tool-call argument values are an unescaped XML boundary. Before replaying
assistant history, reject values containing literal </parameter> or
<parameter= delimiters. Treat replayed calls and tool output as untrusted
data; the template cannot escape those sequences.
Echoing reasoning_content back on assistant history turns is what buys a full prefix-cache
hit: measured 100 % prefix reuse when the client returns it, 94.7 % at ten turns when it does
not. Community "fixed" Qwen templates are not recommended here: measured against
--tool-call-parser qwen3_coder, qwen3.8-froggeric-v22 renders a tool call whose arguments
the parser recovers as {}. Details in
docs/39-chat-template-audit.md
and receipts/chat-template-audit.json.
The paired MMLU-Pro suite above has now run for this build and all five comparators, and this build is a measured shortfall against the pre-registered bar: 54/57 BF16-pass retention, Wilson 95 % lower bound 85.6 % against a required 90 %. At 70 items the suite cannot certify that bar for any result that gives up more than one paired pass, and its intervals separate no two candidates, so public capability here is measured but not established — one 70-item multiple-choice draw, with no executable-code, constraint-following, tool-schema or larger-draw evidence yet (the plan's own P1). Also unverified: real OCR/chart/document/video quality, long-context retrieval or perplexity for this build, native-262K or YaRN-1M generation, multi-GPU or TP>1, non-SM120 hardware, and quant-specific safety regression testing. Throughput was not re-measured here: this build shares the sibling's kernels and resident footprint, so its decode and prefill figures should carry over — that is an inference, not a measurement.
Evaluation captures and reports for the v3 rows are published in the fidelity dataset, for the v3 rows covered by those captures. The v5 headline run's candidate captures are gone — deleted shard by shard to fit 135 GB of scratch — but its shard-0 BF16 reference, the suite itself and all 79 per-shard reports are published, so it is both recomputable from the pinned corpus fetch log and suite manifest under Suite identity and replayable against the published reference: see Reproduce this.
release-evidence-hydrated.json
carries the whole chain in one file: shard and index SHA-256, upstream revision and the
verified 1,199-tensor topology, research and exllamav3 commits with tree-clean state, the
container digest and the patched module's hash, hardware and driver, suite token hash and
partition, every fidelity number with its interval, the controls including the replay floor,
and an explicit not_verified list. SHA256SUMS covers the immutable payload (16 files);
DOCS-SHA256SUMS covers card files, so a card edit can no longer invalidate the build hashes.
One correction to that chain: the container digest it records is not a complete environment
record. The image behind that digest has no marisa_trie, which this conversion imports on two
unconditional paths, so it could not have run the build to completion on its own; something in the
published run supplied the dependency and nothing recorded what. The conversion-capable image is
gg-r34-convert. The shard digests the file carries are unaffected — they
describe the published bytes, which is the artifact.
That file's fidelity chain is the v3/v4 evidence. The v5 headline numbers live in their own
receipts: receipts/kld5-suite-manifest.json, receipts/kld5-corpus-fetch-log.json,
receipts/kld5-10M-{hyd,k5k6,ctx,fp8,k4}.json and receipts/kld5-10M-paired.json, each
carrying the suite token hash, the cluster partition and its own content digest.
This section is about the numbers, not the bytes: it reproduces the measurements, and a fresh conversion of the recipe produces a sibling rather than this checkpoint (see What a rebuild of this recipe gives you).
The preserved v5 inputs and reports, but not all historical captures, are published as a dataset:
malaiwah/qwen38-27b-fidelity-suite-v5
— 5,835 files, 10,826,796,868 B (10.83 GB / 10.083 GiB), verified at revision 08bde6cc. It
contains the 5,120 token-id files that are the authoritative evaluation input (retokenizing the
source text does not reproduce them), the parent suite manifest whose sha256 equals the ladder pin,
the ladder pin itself, all ten 512-context shard views with their capture and replay command lines,
the corpus fetch log, the shard-0 unquantized BF16 hidden-state reference (512 captures plus
manifest, 10.73 GB) and 79 per-shard reports — 50 ladder, 10 tail, 15 scored-window, 4
cross-engine. Receipt
receipts/preserved-artifacts.json;
5,326 of the 5,835 files were re-downloaded and re-hashed end to end, and the 10 GB hidden-state
tree was checked against the Hub's own LFS digests plus a three-file CDN spot check.
What it costs to replay. Because the suite and the shard-0 BF16 reference are both published, a third party can score a new candidate against the identical contexts without recapturing the reference: one candidate capture plus one replay, about 6 minutes of GPU for shard 0 on a single RTX PRO 6000 Blackwell, instead of two model loads. That is exactly how the NVFP4 row in Against GGUF was produced. Re-running the whole ten-shard ladder is a different bill — about 5 hours of GPU for the fifty candidate captures, plus about 54 minutes for the nine BF16 shard references that were deleted once their reports verified.
Seven archival mirrors keep the third-party citations resolvable — the three explained below, plus the four quant-landscape shortlist mirrors cited elsewhere on this card, each pinned to the exact upstream revision measured and each now carrying a provenance banner that names its upstream author.
malaiwah/Qwen3.8-27B-NVFP4-archival-9c73e2da
is a recovery mirror: upstream super-squashed its history on 2026-08-15 and the Hub now answers
Invalid rev id for 9c73e2da…, the revision every NVFP4 number on this card was measured against,
so the reviewed revision is otherwise unreachable.
malaiwah/Qwen3.8-27B-GGUF-archival-f1bfb127
is precautionary: the five files the cross-engine table cites, at a revision that still resolves
upstream. malaiwah/Qwen3.8-27B-NVFP4-RTX5090-archival-69274a0d
is likewise precautionary: the gittensor checkpoint measured above, at a revision that still
resolves upstream, deep-verified after upload — its 19.2 GB of weights cost essentially zero
transfer because the Hub already held every chunk. Said plainly, a mirror preserves the citation — a resolvable repo id, revision and
digest table that survive an upstream squash or delete — and is not independent byte-level
redundancy. Hub storage is content-addressed, so our copy and upstream's plausibly reference the
same underlying chunks; nobody should assume physical copies we do not hold. The measured cost of
the first two mirrors was 2.34 GB of transfer for 149.3 GB of content, about 1.6 %, which is that
content-addressing showing through.
voipmonitor/vllm Docker images, the rtx6kpro serving wiki, and the exl3-b6 online-encoding overlay whose distribution-fidelity protocol this evaluation follows.malaiwah/GLM-5.2-EXL3-TR3-MTP78: the graft/encode/serve procedure for the MTP draft layer, plus the vLLM normalize_rank_sliced_weight_name() loader patch.GLM-5.2-EXL3-TR3-MTP78 checkpoint, and the RTX 5090 context-capacity qualification that caught a 262K overclaim.Base model
Qwen/Qwen3.8-27B